When the Chiefs lost to the Patriots in their home stadium last week, it didn't take long for the fingers to start pointing.
Missed calls, inability to make key stops on defense and lining up in the neutral zone all got their fair share of representation in the Blame-a-polooza. But when we look inside the numbers, what do we see? The Krumholz Axiom, "Figures Don't Lie, But Liars Figure" has not let us down yet. Let's look at the numbers...and get beyond the chatter.
Strengths vs Weaknesses
When looking at the 2018 statistical performance, here is how New England fared:
On Offense, they generated 7.42 yards per pass attempt, 8th in the league and 4.26 yards per rush, which ranked 20th.
On Defense, they gave up 6.52 yards per pass attempt, again for 8th in the league and 5.07 which was shockingly, the worst measure in for the NFL in 2018.
Based on the above, their strength is passing the ball on offense and pass defense while their weaknesses are running the ball and stopping the run.
You don't need to be a Lombardi to figure out how to beat the 2018 New England Patriots: Stop their passing game and prioritize your run game.
In their 5 losses this year, that is exactly how they got beat, per the table below:
In each of their losses they were not effective in either of their strengths and had their weaknesses exploited.
Now let's see what the Chiefs did...
While the Pats' passing game was held in check being out gained 7.57 yards to 8.03 yards given up, the difference was the Pats overcoming their weaknesses by outgaining the Chiefs on the ground, gaining 3.74 yards per rush and only giving up 3.42 yards.
What's most striking is the Chiefs were a pretty good rushing team (I had them 6th in the league for rush/attempt rate and 8th for rush defense) but it looks like they didn't incorporate the run into their game plan the way other teams who beat the Patriots did (on average, they ran the ball 27.8 times compared to the paltry 12 times the Chiefs toted the rock). SAD!
...it was the coaches...
Will be re-watching the game to see what happened in terms of the run game plan but given the preparation for which the Rams' coaching staff is becoming known, don't be surprised when you see Gurley and Anderson pounding the ball 20-30 times combined Superbowl Sunday.
Christmas comes but once a year, but the NFL draft is a year round event. With just the collegiate all star games remaining, it's as good a time as any to kick of the player evaluation process with a side by side comparison of the top prospects based on review of game footage.
This is For My Homie
The Defensive End position has been abandoned by Draftniks. The untimely death was caused by the migration of the DE and OLB into something called the "EDGE" position; this is really messing with old dudes like me. Nonetheless, we will adapt and present the "EDGE" players with the assumption that, despite being a mish mosh of two positions, we will evaluate them for their overall prowess not necessarily evaluating based on any prototypical position expectations. For this piece we are looking at Defensive Ends.
Let the Football Film Fight begin!
The rules are simple: We line up the top prospects for a given position (with a possible wild card or two of my choice thrown into the mix) and randomly select a player. We watch and evaluate his game based on no more than 3 video viewings. We select another player at random and view 3 of his games. One has to go. The survivor takes on the next contestant in a head to head elimination round and so on until we end up with the Battle Royale winner!
Let's take the top 15 Drafttek Sports Information "EDGE" rushers (DE) and pit them head to head in reverse order to see who emerges victorious. FYI - There will be a FFF for Outside Linebackers at a later date, so don't miss those "EDGE" rushers.
Round One: #15 Christian Miller, Alabama vs. #14 Jalen Jelks, Oregon
Miller vs. Arkansas 2016, Ole Miss 2018 and Missouri 2018 - Marginal improvement over the viewing period although his ability to disengage blockers was better early. Will need to work on quickness at the next level. Able to drop into coverage.
Jelks vs. Arizona 2017, Washington State 2018 and Boise State 2018 - Eyes in the backfield at all times. Did not see the impact I thought I would. Will need to improve quickness for efficacy in the league.
Decision: Jelks - Did not see the traits I expected to see from Miller, being son of an NFL veteran (Corey Miller). Jelks showed more power and awareness.
Round Two #14 Jelks vs. #13 Ben Banogu, Texas Christian
Banogu vs. Baylor 2017, Texas 2018 and Oklahoma 2018 - Quickness is an issue he will need to address or his 3 cone showing could hurt his draft stock. Needs to hurdle cut blocks. Not a sideline to sideline guy.
Decision: Jelks - Double J won more individual battles and, although the production was about the same, he had more success controlling his man.
Round Three: #14 Jelks vs. #12 Chase Winovich, Michigan
Winovich vs. Ohio State 2017, SMU 2018 and Penn State 2018 - Doesn't quit. Nice punch off the line. Could add a move or two to his repertoire. Has to set the edge; can't get sucked inside. Sideline to sideline.
Decision: Winovich - Gives a lot of effort out there showing more quickness than the prior candidates.
Round Four: #12 Winovich vs. #11Wyatt Ray, Boston College
Ray vs. Notre Dame 2017, Virginia Tech 2017 and Wake Forest 2018 - Will need to work on explosiveness and decisiveness.
Decision: Winovich - Overall, Winovich excelled in every aspect of play. Ray is listed as earning all-state honors his senior year in high school in Florida so expectations were high.
Round Five: #12 Winovich vs. #10 D'Andre Walker, Georgia
Walker vs. Auburn 2017, Alabama 2018 and Kentucky 2018 - Quickest candidate so far. Eyes in the backfield. Fourth quarter fatigue or quit in the upset loss to Auburn? Can get enveloped by blockers.
Decision: Winovich - Despite being named the Bulldogs' Defensive MVP for this past season, Walker did not match the consistent level of intensity of Winovich.
Round Six: #12 Winovich vs. #9 Austin Bryant, Clemson
Bryant vs. NC State 2017, Duke 2018 and Boston College 2018 - Needs to shed blocks. Has nice quickness. Finally impacted the game late vs. BC.
Decision: Winovich - Did not see very much impact from Bryant in the games viewed much to my surprise.
Round Seven: #12 Winovich vs. #8 Shareef Miller, Penn State
Miller vs. Iowa 2018, Pittsburgh 2018 and Appalachian State 2018 Would like to see him use his arms more to shed blocks and reduce getting driven off the ball. Some quickness there. Takes appropriate pursuit angles.
Decision: Winovich - Did not see Miller take over a game like you need to see at this level.
Round Eight: #12 Winovich vs. #7 Joe Jackson, Miami
Jackson vs. Wisconsin 2017, LSU 2018 and Florida State 2018 - Gets off the ball. Effectively uses club and swim moves to gain position. Eyes always in the backfield. Can consistently shed blockers to make tackles. Fights through double teams. Legs drive through contact.
Decision: Jackson - Even if he doesn't win this Football Film Fight, you want him on your team.
Round Nine: #7 Jackson vs. #6 Anthony Nelson, Iowa
Nelson vs. Miami (OH) 2016, Iowa State 2018, Penn State 2018 - Gets off the ball without being quick. Strong - fought off a double team for a sack. Uses his arms well to shed blockers.
Decision: Jackson - Nelson has proven himself effective but Jackson is the clear choice between the two.
Round Ten: #7 Jackson vs. #5 Jaylon Ferguson, Louisiana Tech
Ferguson vs. WKU 2016, Mississippi State 2018 and Florida Atlantic 2018 - 2016, Locks up with blocker when he should use his long arms to keep distance. 2018 games show improvement over 2016 footage in terms of shedding, eyes in the backfield and pursuit off the play. Shows coachability as he has grown into a much more complete player.
Decision: Jackson - Ferguson has talent, but doesn't play with instinct yet. Jackson remains the most impactful player in the survey.
Round Eleven: #7 Jackson vs. #4 Oshane Ximines, Old Dominion
Ximines vs. Liberty 2018, Marshall 2018 and East Carolina 2018 - Eyes in the backfield but sometimes I'm not sure what he sees. Wrestles instead of sheds a bit too much. Nice Deflection/INT vs. Marshall. A couple of moves in his toolbox. Nice leg drive...should test well at the Combine.
Decision: Jackson - Ximines has huge upside in the right system but Jackson is ready now.
Round Twelve: #7 Jackson vs. #3 Montez Sweat, Mississippi State
Sweat vs. Arkansas 2017, Alabama 2018 and Kansas State 2018 - Uses arms to keep blockers from getting into his body. Reaches for tackles. Quick off the ball. Can generate a lot of power.
Decision: Jackson - Closest match up yet; with increased intensity, Sweat will be a force in the league.
Round Thirteen: #7 Jackson vs. #2 Clelin Ferrell
Ferrell vs. NC State 2017, Texas A&M 2018 and Boston College 2018 - Uses long arms well in shedding blockers. Can lose track of the ball and follow the fake. He can drop into coverage. Plays with intensity.
Decision: Jackson - This was tough but in the end, defenses have to worry about the entire Clemson DL but can focus resources on Jackson and still, JJ is more impactful.
Round Fourteen: #7 Jackson vs. #1 Nick Bosa, Ohio State
Bosa vs. Wisconsin 2017, Texas Christian 2018 and Oregon State 2018 - Very quick. On the edge, if he gets a jump he's gone. Needs to keep spacing; if a blocker gets into his chest he's neutralized. Will need to find the ball in the backfield quicker at the next level.
Decision: Jackson - Seeing in believing. Bosa will have his success at the next level, but over the viewing, Jackson was supreme.
Football Film Fight Defensive End Champion
Joe Jackson, The U
Going into this, I assumed it would be Bosa or Ferrell; both will be first round talents but I see Double J as a huge value given where I'm seeing him projected in mock drafts and Big Boards.
Christmas comes but once a year, but the NFL draft is a year round event. With just the collegiate all star games remaining, it's as good a time as any to kick of the player evaluation process with a side by side comparison of the top prospects based on review of game footage.
Let the Football Film Fight begin!
The rules are simple: We line up the top prospects for a given position (with a possible wild card or two of my choice thrown into the mix) and randomly select a player. We watch and evaluate his game based on no more than 3 video viewings. We select another player at random and view 3 of his games. One has to go. The survivor takes on the next contestant in a head to head elimination round and so on until we end up with the Battle Royale winner!
This first FFF will be between the top cornerback prospects according to Drafttek Sports Information who list the CBs in their top 200 prospects as so:
Greedy Williams, LSU 6'1" 182 lbs (2.49 lbs/in in terms of simple mass)
Byron Murphy, Washington 5'11" 182 lbs (2.56 lbs/in)
Mullen vs NC State 2017, Duke 2018 and Boston College 2018 - Got fooled on a trick play vs NCSU but did not bite on a similar look later so that was an impressive in game adjustment. Could be more physical in run support. Plays tight coverage but would like to see more PBUs when targeted.
Bryant vs Auburn 2018, Penn State 2017 and Ohio State 2018- Nickel but run support like a safety. Definitely not shy of contact although he'll want to focus on open field tackling technique. Very well prepped for Auburn; film rat? Huge mistake in Fiesta Bowl, reaching for a bump in off coverage, couldn't recover.
Decision: Bryant - Not sure anyone will give him a shot outside of the nickel, but his instincts for run support are superior and he clearly is very well prepared. Once Mullen can convert his knack for tight coverage into PBUs, he will reach his full potential, which is very high.
Round Two - #12 Bryant vs. #16 Baity
Baity vs. Northwestern 2017, Missouri 2017 and Florida 2018 - What he lacks in physicality in run support he makes up in physicality in pass coverage. Dude can lay the lumber.
Decision: Bryant - Baity can make you pay when they throw at him but Bryant gets the edge for consistency.
Round Three - #12 Bryant vs. #14 Holder
Holder vs. Oregon 2018, Notre Dame 2018 and Utah 2018 - Engages blocks but needs to shed a bit quicker. Willing to support run. Can sometimes provide a bit too much cushion.
Decision: Bryant - While both seemed well prepared in every game, the difference was aggressiveness attacking a target and overall efficacy.
[Have to admit, I'm surprised Bryant made it this far but he's only been underdog once.]
Round Four - #12 Bryant vs. #3 Boyd
Boyd vs West Virginia 2018, Iowa State 2018 and USC 2018 - Lot of contact downfield that would be called at the next level. Appears more quick than fast. Will need to study routes to improve recognition. Solid technique.
Decision: Boyd - Definitely will have to work on reducing the contact, he is aggressive and plays tight coverage showing solid break up fundamentals.
Round Five - #3 Boyd vs. #4 Baker
Baker vs. Oklahoma 2018, Missouri 2017, South Carolina 2018 - Fast, fast, fast. Seems like he can get lost occasionally. Struggled a bit vs. Mizzou's big WRs. Hair on fire vs. SCAR; got a little chippy to the detriment of the team so needs to watch emotion.
Decision: Baker - Better coverage man without being grabby. Has much better make up speed and is also not shy about contact. His improvement over the period is astounding.
Round Six - #4 Baker vs. #9 Love
Love vs. NC State 2017, Michigan 2018 and Vanderbilt 2018 - Gets lost sometimes. Willing to play hardnosed defense and support the run. Lost on a good hard pivot point.
Decision: Baker - Better all around athlete, tighter in coverage and higher field awareness.
Round Seven - #4 Baker vs. #10 Gilbert
Gilbert vs. Virginia Tech 2017, Baylor 2017and Sophomore compilation - Very tight coverage he's like a mirror. Didn't see a lot of opportunity for run support but aggressive defender. Very grabby at the end of routes.
Decision: Baker - Gilbert suffered a hip injury early in the 2018 season so it is unclear if he will declare. Either way, he will have to work on eliminate holding from his closing technique or he will be an NFL penalty machine.
Round Eight - #4 Baker vs. #2 Murphy
Murphy vs. Penn State 2017, Arizona State 2018 and Utah 2018 (Pac 12 Championship) - Plays a lot of off coverage and seems to disappear. Had a couple of INTs. Struggled vs. larger receivers.
Decison: Baker - Murphy will provide run support when he can but comparatively, Baker has had more impact on the field for his team over the season.
Round Nine - #4 Baker vs. #11 Ya-Sin
Ya-Sin vs. Buffalo 2018, Maryland 2018 and UCF 2018 - Plays well tight or off. Solid run support. Fast and strong.
Decision: Baker - Ya-Sin is very impressive and will be a nice pick up for someone, everything he does well, Baker does even better.
Round Ten - #4 Baker vs. #1 Williams
Williams vs. Alabama 2017, Texas A&M 2018, Georgia 2018 - Plays tight, but very, very grabby downfield. Will need to work on run support. Some incredible closing speed.
Decision: Baker - Williams is amazing but the "grabbiness" may impact his efficacy at the next level.
Round Eleven - # Baker vs. #6 Oruwariye
Oruwariye vs. Michigan State 2017, Iowa 2018 and Pittsburgh 2018 - Tremendous improvement in coverage, anticipation and open field tackling year over year. Can work to fight through blocks. Patient through double moves. Laid the lumber a couple of times.
Decision: Baker - Oruwariye improved his standing with a strong 2018 and based on the games viewed, should improve his final ranking here. Baker just too strong.
Round Twelve - #4 Baker vs. #7 Fulton
Fulton vs. Alabama 2018, Georgia 2018 and Texas A&M 2018- Showed solid cover skills. Run support should be more consistent with NFL coaching.
Decision: Baker - On the field, Fulton should have no problem living up to his potential with next level coaching but there are other concerns that may keep him off he field making him a risky pick.
Round Thirteen - #4 Baker vs. #8 Jackson
Jackson vs. Wisconsin 2017, Florida State 2018 and LSU 2018 - Definitely improved the most over the viewing period. Will need to improved disengagement techniques with pro level WR blocking. Can get turned around at times.
Decision: Baker - If Jackson's learning curve continues as it has from the 2017 bowl game vs Wisconsin to his 2018 footage, he can be one of the best, however today, it's Baker.
Round Fourteen - #4 Baker vs. #15 Bunting
Bunting vs. Akron 2018, Buffalo 2018 and Kentucky 2018 - He is aggressive and can cover. Adding bulk/strength should help him get off blocks. No fear. Didn't see a lot of grabbing on deep routes.
Decision: Baker - Bunting is definitely a sleeper pick but will be interesting to see his weigh in for the draft process as tends to get out muscled.
Final Round -#4 Baker vs. #13 Marshall
Marshall vs. Stamford 2017, Washington State 2017 and Texas 2018 - Not a lot of USC 2018 footage readily available. The best of the bunch in terms of run stopping. No fear. Not very grabby downfield. Quick to adjust to routes and fast to close.
Decision: Baker - Will do a deeper dive but hard to evaluate Marshall's growth from just 1 2018 game in the bunch, Good but Baker just stands a cut above.
Football Film Fight Cornerback Champion
De'Andre Baker, Georgia
From the game footage I watched, Baker was just a cut above. He played SCAR game at a different speed than everyone else. Looking forward to his pre-draft process.
Last year, we reviewed the 1st DraftTwitter Top 100 NFL Draft Top Propsects for 2017 - an aggregate list made up of contributions from average ordinary schmoes like you. After crunching the numbers, our picks provided more value per our method than the actual NFL draft. There was much celebrating amongst the people and joy in the land!
The process of comparing picks can be quite subjective. Baker Mayfield went #1 in the draft but the People selected Quenton Nelson the top prospect overall. One is a highly visible QB,the other is an interior offensive lineman who doesn't generate commonly distributed statistics. So how do we compare them?
This analysis simply breaks up the draft into Position Groups (that is, centers, safeties, guards, etc) and evaluates the baskets; but how are they evaluated?
Step II - Snaps, not Stats
As seen above, it would be surprising if anyone could get concurrence from a large group that using stats to compare a QB vs a G would be a clear cut way to measure one against the other. A previous article comparing the results of the 2017 DraftTwitter draft on a per Scout basis used games started as a barometer for success in the league. The rationale there was the coach will start the players who give him the best chance to help the team win the game.
In comparing the players in the way described in Step 1, above, this quickly proved to be ineffective. It was found that a player's % of Total (offensive or defensive, as the case may be) Snaps gives a better picture of how much that player's coach relies on him to contribute to his team's success.
So, in order to remove the subjectivity from the debate, the judging was predicated not on yards or tackles or touchdowns (which stats don't apply to many players or can be misleading in many cases) but on the percentage of Total Snaps as well as Average Draft Position (ADP) of the players in that peer group.
Step III - The Cobra Kai Rule: No Mercy
One could argue that exclusion of players who were injured and placed on injured reserve or simply did not make a team was fair so as to not tank averages with a bunch of zeros but...where's the fun in that?!? No mercy, you made the picks now deal with it. So players like Isaiah Wynn, who started the season on injured reserve after being a top 40 pick, was a double edge sword in tanking both metrics.
Step IV - Add'em Up: The Showdown Part II: DraftTwitter vs. the NFL Draft
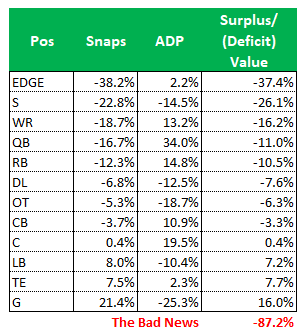
So what you are looking at above breaks out each player position and shows how much better (positive) or worse (negative) than the actual draft our survey performed. For example, the "Edge" players included in the People's Top 100 participated in 38.2% fewer defensive snaps than the "Edge" guys in the first 100 NFL selections in 2018. This is partially offset by the average ADP being 2.2% higher resulting in an adjusted Deficit value for the People of -37.4%; that is, the league got 37.4% more value out of that position than we did. YEET!
On an aggregate basis, the People got smoked with the Shield getting over 87% greater value out of their Top 100 picks. Let's take a deeper look...
Theory vs Reality - That arguably the best player in the draft (Nelson) was picked 6th because he is a guard tells you more than just talent goes into these decisions. When you draft a guy high, you had better get him on the field. Naturally, the highest drafted players get trotted out unless their game puts the "ink" in stink.
Average Snap % for NFL Top 20: 80.9%
Average Snap % for the People's Top 20: 72.0%
Honestly, it's Your Fault - The number of participants from you, the people, dropped to the point the numbers were impacted. The model needs a large enough sample to smooth out wacky picks (like Christian Hackenberg as QB1...some guys!) that could sway the final tally. So get a ballot and vote!
Dice Rolls - Let's face it...fans dream of being GM of their favorite team. We can get a little bit carried away. And in 2018, the People were just a bit too gung ho about players for whom we would "pound the table". Gambles on guys we like who didn't get on the field enough hurt our performance vs. the NFL because, as we learned above, teams are going to play their high draft picks no matter what.
Average ADP of Low Impact Snap % Players for actual draft was 65.2
Average ADP of Low Impact Snap % Players for the People's Top 100 was 67.3
We will define Low Impact Snap % Players as those more than 1 standard deviation below the mean. Although the difference in this case is relatively small at 2.1, the Shield had only 16 of such players in their top 100 while the People had 23. That's about 44% more players dragging down the numbers.
Team Blutarsky - The Cobra Kai rule bit the People in the soft meat, that's for sure. Injuries contributed to a 100% increase in zero point zero Snap % for the People (10) compared to the NFL actual draft (5). Fat, drunk and on injured reserve is no way to go through life, son.
Summarily...
The People got housed. And it was really bad. But, with so many players injured, we're hoping we can rebound in the second year of the 2018 draft class to eliminate or, at least, close the gap.
Keep an eye on this space for the Sophomore Report for an update of the People's Top 100 vs. the actual NFL draft...we were ahead by less than 2% at the end of the 2017 season...check back to see how well that group has seasoned in year 2!
The 3rd Annual People's Top 100 survey is our right now! It's 100% free and 97.3% fun!
Just leave a comment or shoot me an email to boombearfootballmail@gmail.com for an email link to the online Excel worksheet form with dropdown lists for ease of use!
Since week 1, the ROI listings were based exclusively on catches and reception yards. Just like the prior years, the Complete ROI figures will exclude running back statistics from team aggregate statistics and consider target information so that we can truly understand what each player did with his opportunities relative to his team and, using that info, how he compares to his peers.
Why ROI?
Return on Investment (ROI) began nearly 5 years ago in an attempt to try and identify draft eligible wide receivers who may have huge potential, but were not part of any hype machine that would make them household names. After a natural evolutionary process, this current version of ROI has been in place 3 years and has put the spotlight on players like Kenny Golliday (DET), Cooper Kupp (LAR), Mack Hollins (PHI), Tim Patrick (DEN) and Keke Coutee (HOU). Each week through the season the top ROI receivers were presented based and the final FBS rankings are listed below. Although there are high ROI players from FCS and DII in the NFL who were presented in this space, the difficulty in obtaining all the data required for complete ROI prohibits inclusion of non-FBS rankings here.
Updated 1/5/19: Thanks to Jimmy Williams for pointing out the original list had suffered from inadvertent filters. The table and commentary are updated.
Ground Rules
So what goes into ROI?
Player target, reception and receiving yard statistics for the top 150 receivers in terms of receiving yards are analyzed on a peer basis.
Draft likely players are included initially (juniors and seniors) with declaring underclassment added as they make announcements.
The three "raw" ROI metrics resulting from these analyses are combined to provide an aggregate ROI number.
Each player's aggregate ROI number is compared to the average to present how much better or worse than average he is; this is the ROI number discussed below.
Any player with total receptions at least 1 standard deviation within average or better qualifies for inclusion in the final list (this is the Sammy Coates-Devin Smith Rule to screen out players who may have better results because they are used as deep threats only).
Touchdowns are not included in ROI because there are many factors beyond a receivers skill level that could result in a score. However, a metric comparing a player's receptions/TD rate to that of the rest of his team is included to give an idea of how much the player impacts the team in terms of scoring. This "TD Rate" compares performance to each players teammates, not directly to each other.
So Who Are the Most Efficient WRs in FBS?
The key for the above table is as follows:
Green Bold
Tier I
Green
Tier II
Blue
Tier III
Yellow
Tier IV
Orange
Tier V
Orange Bold
Tier VI
Notes:
Tier I - Damion Willis Stands Alone: After spending many weeks on the raw ROI listings throughout the 2018 FBS season, the 6'4" 199 lbs Troy receiver settles at the top spot at an astounding 288% more efficient than average - that's about twice the ROI of fourth place finisher, my draft crush, Hakeem Butler. He is our only Tier I ROI talent having converted 22.5% of Troy receiver targets into 23.1% of team receptions and 33.0% team reception yards. Willis was 1st team all Sun Belt and was an all state (MS) selection in high school. Although only regular season stats are included in ROI, Willis went off for 13/110/2 vs. Buffalo in the Dollar General Bowl. Willis also showed out in terms of TD efficiency producing at a rate 284% faster than average compared to his peer group.
Tier II - The Magnificent Seven: Mooney, Anthony and Olabisi Johnson, Butler, Miller, Campbell and Patmon all showed out with ROI efficiency at least 118% better than average - their rate of production in relation to their opportunities were more than twice the sample average. This is what ROI is all about; low profile guys who ball out but are not at the fore front of everyone's "top" draft prospect lists. Butler proved to be the Cyclones touchdown machine with TD efficiency of over 300%.
Tier III - Above Average with 1 StDev: Of course, the masses comprise the middle and on the positive side of the mean we have some names who you may have heard tossed around as potential prospects like Isabella from UMass (who led FBS in receiving yards during the regular season) and Marquis "Hollywood" Brown from Oklahoma.
Tier IV - Below Average ROI with 1 StDev: Below the mean, yes, but not necessarily "bad". These players are on the other side of the mean, within 1 standard deviation of the average. Future potential stars and likely high draft picks Harry of ASU, Johnson of Texas and Campbell from THE Ohio State University have built a solid track record and have all the physical tools to succeed at the next level. You will find some likely top draft picks in this list, which shows ROI is better at discovering gems than determining busts
Tier V - How the Mighty Have Fallen: Last year, Guyton, Thompson and Brady were constantly high ROI performers. This year, they have not repeated. Guyton faced competition from Bussey at North Texas (see table above) , Thompson (a favorite of mine last year) was rebounding from a season ending injury and it will take a bit of study to find out what is driving Brady's dip (possibly change in QB?).
Tier VI - Detective Time: Simply being near the bottom of the ROI list is no reason to abandon a prospect; Lodge is a highly regarded and talented prospect but his 26.7% target rate 25.0% reception rate and 22.0% reception yard rate reflects performance -223.5% below the sample average. Most likely, his top flight receiving corp impacted his opportunities and potentially, his overall efficiency.
ROI IS NOT A LEADING INDICATOR!!!!
As I have mentioned frequently, ROI is not a WR ranking system. There will be many high ROI guys you will never hear from again and there are guys at the bottom of the list GMs will trade up to get. This is simply another tool to help screen out players who may not get as much media attention for additional research.
What time is it? DraftTwitter Top 100 Time! Now is your chance to participate in the annual aggregate top 100 ranking of draft prospects. It's fun, it's free and it's a great way to interact with talent evaluators of all levels. Check out the 2nd annual results to get an idea of what we do and follow me on Twitter for updates on receiving the easy online ballot which will be available soon!
Follow me on Twitter @boombearjr
or at my Facebook page: Boombearjr Football Analysis (also @boombearjr)
With the regular season behind us, we can start looking into the numbers to see what players were hidden from our view because they did not have the media push of some others. Despite our not hearing about some talented players from week to week because of geography or program promotion, we can look at the season's statistics to see if we cannot mine some lunch pail guys who will put in the work if they get the chance at the next level via the NFL Draft.
Although this space focuses on the wide receiver position, during this time of year from the bowl season to the NFL Draft, I provide different updates on positions and topics of interest . This week, we are focusing on front seven defenders generating the most tackles for a loss.
Tackles for a Loss - Statistical vs Real World analysis
Although they both require looking at a lot of numbers, keeping score of a game and beginning your player evaluation on the stat sheet are two different jobs. As such, there are variances that should be distinguished when considering how we should measure tackles for a loss:
The "Half" Tackle
Look at any stat sheet for tackles for a loss (TFL) and you will see them listed in increments of 0.5 TFL. That is because, of course, if a player is tackled by 2 players, to give each player credit for a whole tackle would indicate there were 2 tackles on 1 play... If you had shared tackles on every down you could have 60 plays with 120 credited tackles. So, clearly, when players arrive at the same time, they split the tackle for statistical integrity.
But why do we split up the assist tackles when evaluating players? In the statistical world, a player with 10 solo tackles and 10 assisted tackles gets credit for 15 total tackles. But, in the real world, he got "home" 20 times so it is critical that draft evaluation should consider the entire picture. In our analysis, we calculate adjusted total tackles for loss as Solo TFL plus Assisted TFL.
Total Tackles for Loss per Game
Comparing the number of tackles for loss is not an easy business. It is even more difficult when the ratings are based on TTFL per GAME. I think we can all agree that each game will result in a different number of opportunities and so each player's TTFL should be measured against the number of plays the defense faced (in a perfect world, we would have snap count data, but that comes at a cost). Therefore, this exercise measures Defensive Plays divided by a player's adjusted TTFL.
Average Opponent Strength vs TFL
Let's say two players have the same TTFL grade based on our adjustments above. Do we assume they are equal in our early evaluation work? We could, but what I have done below is include a measure for average opponent strength based on calculating a ratio similar to what we have for the defensive players. This players TTFL grade is further adjusted to reflect the competition faced.
Top Adjusted Tackles for a Loss Rating
Key: Bold Font - Multi sport HS Athlete; Italics - HS All State Athlete; Underline - Legacy Collegiate Athlete, Asterisk - Graduated HS before 2015
Rank - Final TFL rank based on SoS Adj column (see below).
Std Rank - The standard rank based on half credit for Assisted TFL and using TTFL/Games Played for ranking.
Mass - A simple measure to quickly normalize player size.
Plays/Total - The ratio of Defensive plays for players team/Adjusted TTFL.
SoS Adj - Final TFL ranking based on adjusting Plays/Total for SoS regarding TFL.
Notes
Michigan State's Willekes was considered #14 for TTFL based on standard scoring however, using our method, he has the best TFL rate in FBS (1 TFL for every 28.95 defensive plays). As a redshirt Junior, I will make sure to take a long look at his game video.
Harvey of ECU leads the FBS stat sheets in TFL and he is 2nd overall in our analysis, not shabby at all. Further film analysis will be necessary to see how a guy can come out of nowhere to stand at the top of the heap for this important statistical measure.
Ejiya of the Mean Green of North Texas had the best pure Adjusted Ranking but the SoS UNT faced knocked him down to #6 overall.
Utah LB Hansen served his Morman mission prior to completing his college career so he is a bit older than most FBS athletes. His numbers were markedly improved based on the SoS having faced so many teams who were stingy in terms of allowing TFL. If he tests well at the Combine, we may be seeing him on Sundays in Fall 2019.
Gopher defenders Cashman and Coughlin not only went to the same high school, they also ended up with the exact same TFL grade...how weird is that? Anyway, each both rose the highest in the top 25 based on Competition adjustment.
I know you're asking, who fell the farthest? UNT is on the list again with Brandon Garner taking up that title. Not through any fault of his own, but only because UNT's schedule was loaded with teams that, on average, gave up a ton of TFL, which somewhat devalued Garner's achievements.
Of course, there are so many factors that go into the numbers the best way to evaluate is to watch game footage. The method used here is not designed to give us an unquestionable list but to give us several, "Who?" moments so we can do deeper research on a potential Sunday starter.
*********************************
What time is it? DraftTwitter Top 100 Time! Now is your chance to participate in the annual aggregate top 100 ranking of draft prospects. It's fun, it's free and it's a great way to interact with talent evaluators of all levels. Check out the 2nd annual results to get an idea of what we do and follow me on Twitter for updates on receiving the easy online ballot.
Follow me on Twitter @boombearjr
or at my Facebook page: Boombearjr Football Analysis (also @boombearjr
FBS holds Conference championship games this weekend and the FCS, D2 and D3 tournaments are underway (and so, no change in those season ending numbers). So let's take a look at the most efficient receivers in FBS based on our own Return on Investment metric after the end of the regular season for 2018.
Week 13
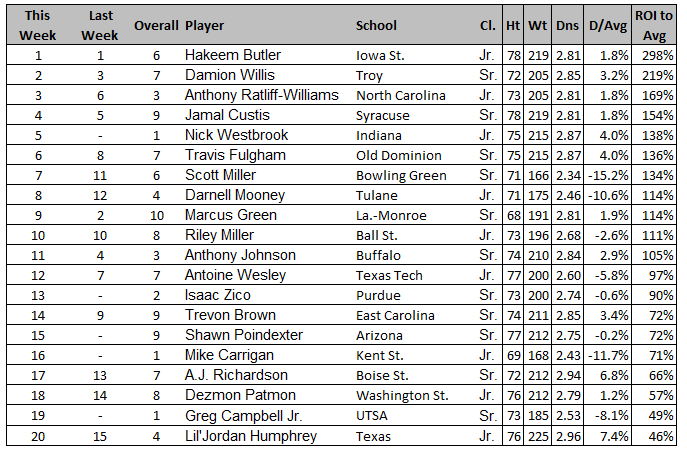
There is a new column to the usual table presented above includes"Density" or weight/height as a simple way to compare body mass of different sized players - for example, 6'1" 205 lbs Ratliff-Williams of UNC is the same "size" as 6'6" 219 lbs Custis of 'Cuse.
D/Avg or Density to Sample Average shows you how under or overweight each player is to the average density of the NFL Top 20 Receivers (in terms of receiving yards).
Based on the above, my boy Scotty Miller from Bowling Green would have to gain about 30 lbs to hit the average...that's a lotta lasagna.
Here are a few comments about some of the Top 20...
He did not go wire to wire but the 6'6" 219 lbs Hakeem Butler of Iowa State spent every week he was in the Top 20 at the #1 or #2 spot, finishing with the top raw ROI of 298% better than average (of the top 150 Rec Yard WRs). Although he has not yet declared, his skill set is on par with some of the top prospects for the upcoming 2019 NFL draft. Here is a nice video from his Travis (TX) High School days which shows his skill set was broad and developed back then...enjoy the music.
Hakeem Butler - Blurry but good!
Louisiana Monroe's Marcus Green dropped from #2 overall at #9 with an ROI to Avg of 114% but has the distinction of the only player to make the Top 20 list each and every week it was published! Dude has a charmed life from his ULM bio (mom is a professional singer, honor roll in HS, balled out at basketball also, etc.). Although he is just 5'8" he is 191 lbs and so he has the body mass to last at the next level. Here is a video of his highlights but don't forget to click through here if you want to see a 5'8" man slam a basketball.
Marcus Green, on a mission
ECU's Trevon Brown has recovered from some tough times to make back to back season ending appearances on our Top 20 list, showing consistency year over year. ECU has quietly churned out some NFL caliber receivers and Brown is looking for the chance to be the next. Not a huge amount of cut up video out for him at this moment, so here is a HS video of him scoring 6 TDs on 6 touches. He shows nice hands here and great concentration; teams must also respect his return ability.
Finally, Shawn Poindexter of Arizona was just one week away from joining Green in earning a spot on each of our Top 20 lists. The former scholarship volleyball player out of high school slipped under the radar after going the JUCO route making All-ACCAC honors in the process. His "late" start hasn't hindered his progress as he led the team in receiving this year. At 6'5, he will draw lots of interest this coming draft season. Here is footage from Glendale CC.
Post Season ROI
As the Bowl games and FCS, DII and DIII tournaments proceed, check out this space for updated, final ROI rankings. These metrics will expand to include target numbers which can always modify the preliminary rankings.
Shameless Self-Promotion!!!
Follow me on Twitter @boombearjr
or at my Facebook page: Boombearjr Football Analysis (also @boombearjr).
Continue to watch this space for more NFL Draft commentary.