What matters most on defense?
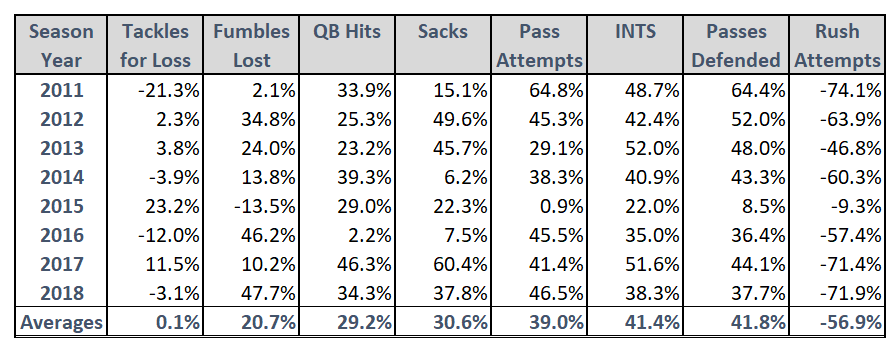
Analytics is effective when it isolates real trends that allow us to better understand what elements help or hurt a football team. In reviewing the defensive statistics of all NFL teams over the last 8 seasons to see which correlates most directly with team win totals, we get the following table:
Notes:
- For each year, I compared each team's win total to their totals for each of the individual defensive statistical categories, above.
- Each percentage reflects the correlation between that statistic and wins.
- A positive number means the a higher statistical total contributor to a win, the higher the percentage the stronger the correlation.
- A negative number would mean that a higher total for that stat has a negative correlation to a win, in effect that stat would be a contributor in a loss.
- 2015 - The Year of Voodoo - I have no idea what happened in 2015 but the data seems to be somewhat against the trends for most categories. QB Hits is the only stat for 2015 that is in line with the average for the 8 season period.
- TFL? No Bueno - So, it seems having a lot of tackles for a loss don't necessary correlate to more wins. In half the years, more tackles for loss had a negative win correlation (that is, greater correlation to a loss than a win).
- DBU - Tied for the top statistical category with the highest correlation to wins is Passes Defended and Interceptions totals, each with over 41% correlation to wins.
- With this in mind, it makes sense that DBs have the 2nd highest average salaries in the league (discussed in my player value article; link at the end of the article, below); clearly, they are very valuable to wins.
- Stating the Obvious - Keeping in mind we are looking at this from the defensive side of the ball, I think we can see that a high number of Rush Attempts has the most impact on wins with a NEGATIVE correlation on average of 57.4%! If we removed that pesky 2015, the average would have been closer to 64%.
- On the flip side, the correlation with the number of pass attempts a defense sees and wins is near the top end of our scale.
Conclusion
Although one could argue the old, "Stop the run, run the ball" adage is proven by the numbers above, I can just imagine all the "well, ACTUALLY" folks lining up to state a team winning would run more to kill the clock so we have no indication as to how that team actually got ahead. But, because at the end of the game a team stacks up run attempts to close out the win, a strong correlation for defenses losing when giving up more run attempts (and winning when the opponent passes more) is evident. Perhaps, but to confirm, let's look at the table with Passing and Rushing Yard totals correlation to win totals.

Well, actually, when you compare the wins to Passing Yards and Rushing Yards, it's clear the negative correlation is much stronger and consistent year over year (curse you, 2015) when a team gives up more rushing yards than it is with passing yards.
So, run the ball and stop the run, as boring as it seem on the surface, is the statistically sound way to play the game.
Looks like the old crazy football guys know what they are talking about. Go figure.
*************************************************************************