Sunday, December 29, 2019

Week 16 NFL Power Rankings...FInal Before Playoff Rankings

Last Licks

Thanks for hanging in all season while looking at the week over week modulations in power rankings.  
Based on the quality of wins and losses weighted more in favor of recent performance, here are the final Power Rankings for 2019.  


Saturday, December 28, 2019

NFL Quarterback Comparison through Week 16

Who's the Man?

The QB position is considered to be the most important single position in team sports.  There are so many elements that go into qualifying performance how do you figure out how to rank signal callers?   Jameis Winston leads in passing yards through Week 16, while Lamar Jackson leads in passing TDs.  Jackson also leads the league in QBR but Ryan Tannehill leads in Passer Rating.  How do you stack QBs?

If you follow this space, it is clear efficiency is a key driver in my rankings and QBs are not any different.  I use a single efficiency metric in analyzing wide receivers (Return on Investment or ROI) but for QBs, we will look at several statistics and the measures of efficiency we get when combining them.

Raw Numbers


The table above reflects stats through Week 16 2019 pulled from Pro Football Reference.com (found here). sorted by passing yards.  The list includes all QBs who have at least one QB decision (win, loss or tie) and total passing attempts greater than 1 standard deviation below the mean for that group (more than 114 attempts).  
The raw numbers are the basis for our evaluation but, as previously stated, they just provide justification for arguing without any context.  So let's see what the numbers can tell us if look at them from different angles...


The table above displays the scaled scores (based on 100 for the top performer with the average score set to 70 and all other scores being set accordingly based on the distribution) as follows:
  • TD% Score - (TD/ATT) Ranking of players based on the TD% rate of the first table, with highest at 100% .
  • INT% Score - (INT/ATT) Same as TD% score but with the lowest at 100%.
  • Yards/INT Score - Based on the number of yards a QB throws between each INT.  I feel this efficiency measure gives a nice impression of scale for INTs.   For reference, Aaron Rodgers throws an INT every 1,226.3 yards while Duck Hodges throws one every 121.0 yards. For further context, both Dak Prescott and Daniel Jones threw 11 INTs but Prescott is just hovering around average with a score of 70.4 while Jones is below at 64.2.
  • Pos/Neg Score - Based on Positive Elements (TDs and First Downs) divided by Negative Elements (INTs and Sacks).  

Correlations for each score relative to the others were calculated and, as a result, the above efficiency measures are averaged two ways:
  • 4 Way Average - Straight averaging of all scores.
  • INT Adj Avg - Given there was a high correlation between INT% Score and Yards/INT Score, these were averaged with the resulting score averaged with the other two scores.  
The above Averages were correlated to each quarterback's respective Win/Loss Record; INT Adj Avg had a stronger correlation to WL Record than did 4 Way Average.  As such, the column next to 4 Way Average reflects QB ranking using that method (and is provided for referece) while the final ranking is based on INT Adj Avg (the far left column) because of the stronger relationship to player results. 

Notes:

  • Young G's - Teddy Bridgewater and Drew Lock did not start a majority of games for their teams but when they did play, they performed at high levels showing up at numbers 8 and 10, respectively.  Teddy is going to continue to be my favorite young QB until proven otherwise and many have Drew Lock as one to watch for the future.
  • Scraping By - The Bottom Five include 3 first time starters in Haskins, Blough and Hodges, sophomore shakes victim Mayfield and, Mr. Krabbs himself, Jameis Winston. who really took a hit with his INT rate of 4.7% which equates to 1 INT every 21.5 passing attempts.  For context, the top man in this category, Aaron Rodgers threw an INT every 171 attempts.
  • Matthew Dangerfield - Stafford has had a rough year.  After throwing his team on his back and fighting losing battles week after week, he is injured and there is talk from the media wall of noise that he will not/should not be on the team next year because he's a valuable asset they could move for a bonanza of picks/players.  Of course, then they would need a QB...dumb dogs always chase their tails, eh?  At any rate, Stafford is top 5 based on this analysis. 
  • Face Off  - How did the QBs of the last three drafts fare when squared off?
    • 2016: Prescott #9 out of 39 (drafted QB8 at #121 overall), Wentz #13 (QB2 and #2 overall), Brissett #14 (QB5 at #91) and Goff (overall #1).
    • 2017:  Mahones #2 out of 39 (drafted QB2 at #10 overall), Watson #19 (QB3 at #12 overall) and Trubisky #25 (drafted QB1 at #2 overall).
    • 2018:  Jackson #3 out of 39 (drafted QB5 at #32 overall), Allen #21 (drafted QB3 at #7 overall), Rudolph #28 (drafted QB6 at 76 overall), Darnold at #29 (drafted QB2 at #3 overall) and Mayfield #35 (QB1 and overall #1). 
  • Prime of Life- The QBs over 40 years old, Brees (#1)  and Brady have an average score of 82.6 which would put them at 3rd on our list if they were one person.  
    • Thirty-something - The guys in their late 30s, (Rivers, Manning, Rodgers and Fitzpatrick) have an average score of 68.7 - take out Rodgers (#4 on our list), the average collapses to 64.6. Yaar!

The Bottom Line

  1. INT Adj Average has a 61.4% correlation to QB Win/Loss ratio.  While the number is not strong, it is solid to infer these metrics have a material impact on team performance and are therefore relevant. 
  2. Dak Prescott is #9 out of 39 when he was QB 121 out of college.  Pay the man.
  3. Overall #1 draft pick in 2016 Jameis Winston is #36 out of 39 with only first time starters behind him on the list. With the "going rate" for QBs at $30MM, it will be interesting to see what the TB GM will do in this situation.

Thanks and check this space for more NFL/College Football analysis.
******************************************************************

GET READY FOR NFL DRAFT SEASON BY CHECKING OUT LAST YEAR'S "THE PEOPLE'S" TOP 100 CREATED FOR US BY US HERE!  

BALLOTS SO YOU CAN VOTE COMING SOON!!!!!


Sunday, December 22, 2019

Power Ranking Trends through Week 15

Seeing is Believing

This season, I've been generating NFL Power Rankings based primarily on Wins and Losses adjusted for Strength of Schedule.  The method is weighted so the more recent the results, the more impact it has on the overall ranking (without ignoring past performance entirely like some analysts seem to do).  Over the last several weeks, I've compared the rankings to those of several media outlets:  ESPN, CBS Sports, USA Today, Sports Illustrated and Bleacher Report individually and on an aggregate basis.   

Below I have provided the charts for most* teams to show just how opinions for each have changed over the last 7 weeks. If you want to see the rest of the charts, check them out here.

* No need to include CIN since the ranking has been pretty much the same over the last seven weeks. 

Bullish

OAK - Sure the Raiders are inconsistent and have had their share of disappointing losses but the bottom line is based on their #13 Strength of Schedule (assuming 1 is most difficult and 32 is easiest), their record is 13th worst in the league - middlin', to be sure, but about where you would expect them.  Clearly, the Experts are punishing OAK by expecting them to play way above their heads.


PIT - When an ordinary team loses its veteran starting QB to start the season after losing their all Pro talent WR and RB in the preseason, the only logical response would be to pour one out on the curb for them and look forward to next year. But Tomlin and company are not an ordinary team.  Nice to see that, despite the low outlook several weeks ago, the Experts have come around to my line of thought.   


SEA - A million years ago I was watching an NC State game and there was this little QB flinging the ball all over the field.  I was like, who the heck is this guy? The weirdest thing was the very next year I was watching a Wisconsin game and they also has a little guy who took the team on his shoulders.  You probably know I'm talking about Russell Wilson, the guy who almost caused a melee between Gruden and the ESPN talking heads during NFL Draft.  The guy has a Kobe/Jordan/Brady will to win and I'll hitch my wagon to that everytime. 


Bearish

LAC - I started out higher than the Experts on this team.  They are solid at the skill positions and have defensive stars but injuries and just lackluster play by their aging QB has soured me.  Not so the Experts.   When a team can notch back to back wins against CHI and GB, I can understand how that would give them a boost, but they have the 8th easiest schedule yet  the 7th worst record in the league...not going to win any beauty contests for me. 


IND - What can you say about a team that had it's #1 overall drafted QB with future HOF potential call it quits in the beginning of the season?  Kind of hard to bounce  back from that but IND is hanging in there.  They have a great chance of finishing even at 8-8 (CAR in Week 16 and JAC in Week 17) so we will expect them to build on the solid group of young players they have.


DAL - You had to  know this would be here, right?  This team has been all over the place in terms of week to week perfomance, as shown on the chart, where both lines are sine wave-ish.  Interestingly, both the Experts and I basically have the Cowboys currently around where we started them.  They routinely  loseto the teams they should lose to and beat the teams they should beat...but you have to beat upper tier teams to notch up on this list and they haven't done that at all this year.  This team is lucky they are in the NFC East.


***************************************************************************

Until next time, check out other articles:

  1. College Football Tackles for Loss Analysis for NFL Draft
  2. NFL - What Playoff Teams are Paying Each Position Vs. Cellar Dweller Teams
  3. College Football Wide Receiver Efficiency Analysis 
  4. NFL - Livin' on the Edge - What Draft Round Produces the Best Pass Rusher Values
  5. NFL - Does QB Aggressiveness Impact Overall Performance? 

***************************************************************************

GET READY FOR NFL DRAFT SEASON BY CHECKING OUT LAST YEAR'S "THE PEOPLE'S" TOP 100 CREATED FOR US BY US HERE!  

BALLOTS SO YOU CAN VOTE COMING SOON!!!!!

Saturday, December 21, 2019

NFL Power Rankings Through Week 15!

Games Still Matter

Thanks to an incomplete playoffs picture, all games still matter this week as teams fight just to make their way into the postseason  and jockey for position for a home game while others look to play spoiler,  

Here's the Power Rankings:


  •  Green columns are This Week's Rankings, the Average Ranking of the Experts and the difference between the current week's rankings.
  • Light Blue columns are Last Week's Rankings, how off the Experts were this week from their rankings for the same teams last week and finally, the difference between my week over week performance compared to the Experts to show who was farther off each pick. Negative numbers mean I was closer to the proper rank (based on the rank the following week), positive, means the Experts were closer. In each case, the "winner" made fewer adjustments and thus was more accurate.
    • This week, I had 16 teams where I had smaller week over week modifications than the experts who had only 9 where they modified less than me.  There were 7 ties.
Working on individual charts for each team showing their weekly Power Ranking to show consistency or lack thereof for me vs . the Experts coming soon!


Strength of Schedule


Let's get at it:


  • Based on the aggregate average weighted strength of each teams' opponents separated into wins and losses, we have the table above which shows the difficulty of each teams' schedule thus far, going from most difficult at the top going down.
  • The colored column breaks out the distribution with Yellow as withing 1 standard deviation from the mean (plain yellow is above the mean, bold yellow is below), 
    • Orange is greater than 1 standard deviation from the mean but less than 2; Green is less than.
    • There is, unfortunately, one red team (greater than 2 deviations above the mean) but CIN has had the toughest schedule wire to wire so far. No blue team (greater than 2 StDev below the mean).
  • Top 10 most difficult schedule but still with winning records:  SEA, KC, HOU and LAR.
  • Top 10 easiest schedule but still with losing records: NYJ and LAC.  Pobrecitos. 
***************************************************************************

Until next time, check out other articles:

  1. College Football Tackles for Loss Analysis for NFL Draft
  2. NFL - What Playoff Teams are Paying Each Position Vs. Cellar Dweller Teams
  3. College Football Wide Receiver Efficiency Analysis 
  4. NFL - Livin' on the Edge - What Draft Round Produces the Best Pass Rusher Values
  5. NFL - Does QB Aggressiveness Impact Overall Performance? 


Friday, December 20, 2019

Bowl Season Picks Against the Spread

Let's Go Bowling!

It's that time of year again where truly addicted football fans stay glued to their big screens watching college games sponsored by companies they've never heard of...Tropical Smoothie Cafe?!

Looking at the teams trying to pick a winner against the spread is fun, but subjective.  So the following bowl selections may not have the most exciting games but it captured the teams that, based on their past performance, seemed to be the best bets based on analysis of several factors: performance in conference vs out of conference results on a team AND conference basis, comparison of Offensive/Defensive TD analysis and how these factors relate to the spread. 

So here are the selections:

Correction- Las Vegas Bowl is 12/21/19

You may notice all picks are the favorites It will be interesting to see how this performs.


*****************************************************************

GET READY FOR NFL DRAFT SEASON BY CHECKING OUT LAST YEAR'S "THE PEOPLE'S" TOP 100 CREATED FOR US BY US HERE!  

BALLOTS SO YOU CAN VOTE COMING SOON!!!!!


Week 15 NFL Picks Against the Spread- Icarus Crashes! And Week 16 Selections

Back to Earth

It couldn't last forever,  The calculations failed this week after back to back weeks of monster performance against the spread.  Just like the winged kid  I came crashing back to Earth at an even 4 and 4 last week. 

Notes:

  • Yuck.

Reload...

Enough feeling sorry for myself. Time to give it a go again this week with the following (bold italics are the statistical best bets for the week):


For entertainment purposes only...PLEASE!


*****************************************************************

GET READY FOR NFL DRAFT SEASON BY CHECKING OUT LAST YEAR'S "THE PEOPLE'S" TOP 100 CREATED FOR US BY US HERE!  

BALLOTS SO YOU CAN VOTE COMING SOON!!!!!

Sunday, December 15, 2019

NFL Power Rankings Through 12/11/19 (Excludes last Thursday's Game) and STRENGTH OF SCHEDULE!

Power Rankings Going into Week 15

Let's not waste any time; here are the rankings alongside those of the Experts at SI, ESPN, CBS, USAToday, and Bleacher Report.


  •  Green columns are This Week's Rankings, the Average Ranking of the Experts and the difference between the current week's rankings.
  • Light Blue columns are Last Week's Rankings, how off the Experts were this week from their rankings for the same teams last week and finally, the difference between my week over week performance compared to the Experts to show who was farther off each pick.

Schedule Strength

  • Based on the aggregate average weighted strength of each teams' opponents separated into wins and losses, we have the table above which shows the difficulty of each teams' schedule thus far, going from most difficult at the top going down.
  • The colored column breaks out the distribution with Yellow as withing 1 standard deviation from the mean (plain yellow is above the mean, bold yellow is below), 
    • Orange is greater than 1 standard deviation from the mean but less than 2; Green is less than.
    • Thankfully, there are no red teams (greater than 2 deviations from the mean) and there is only one blue team, my NYJ who have had the easiest schedule thus far in 2019.
  • Top 10 most difficult schedule but still with winning records:  SEA and KC.
  • Top 10 easiest schedule but still with losing records: NYJ, LAC, DAL, and IND.  Yikes!
Check back next week for the last couple of weeks of the season!

*****************************************************************

GET READY FOR NFL DRAFT SEASON BY CHECKING OUT LAST YEAR'S "THE PEOPLE'S" TOP 100 CREATED FOR US BY US HERE!  

BALLOTS SO YOU CAN VOTE COMING SOON!!!!!


Review of Week 14 NFL Picks (Crushed It!!!) and This Week's Results!

Week 14 in Review

Not too shabby. 


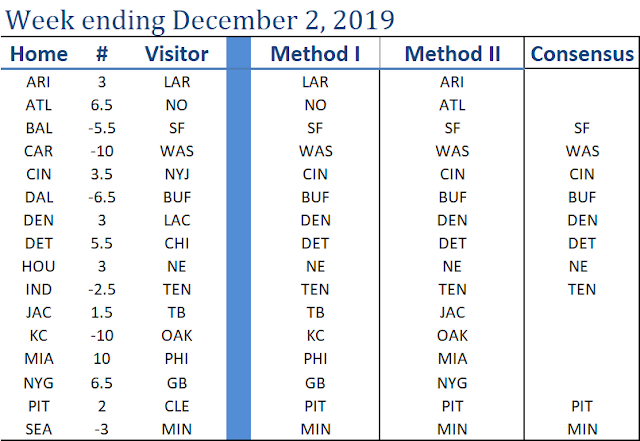
Last week's record was 7-1-1 with the DAL game as the only loss (IND pushed). 

Check out the picks for this week based on crunching of the numbers:


Eight consensus picks.  Thankfully, we had no opinion for the "game" Thursday between my Jets and BAL, so you see it redlined out.

For entertainment purposes only, please!  Check back for updates on the results for this week.  

******************************************************************************

Until next time, check out other articles:

  1. College Football Tackles for Loss Analysis for NFL Draft
  2. NFL - What Playoff Teams are Paying Each Position Vs. Cellar Dweller Teams
  3. College Football Wide Receiver Efficiency Analysis 
  4. NFL - Livin' on the Edge - What Draft Round Produces the Best Pass Rusher Values
  5. NFL - Does QB Aggressiveness Impact Overall Performance? 


Saturday, December 7, 2019

UPDATED!!! FBS and FCS WR Return on investment Through Regular Season

Top Efficiency Receivers for FBS and FCS!


Let's talk about the top-performing receivers in all NCAA divisions when it comes to efficiency based on Return on Investment.  Raw volume statistics don't always indicate the ability of a receiver to manufacture production on his own, so Return on Investment provides context.

Return on Investment or "ROI" seeks to uncover just what the name implies...if I invest a passing target in getting the ball to a receiver, what kind of output in terms of production am I going to get from him?  Starting with the basic concept of the Dominator Rating, the percentage of his team's receiving yards a player generates, ROI goes deeper,  comparing also the percentage of his team's receptions the receiver converts from his targets.  

The player's Return on Investment is compared to other players and, unlike DR, the players are tiered based on distribution using standard deviation; therefore, there is no fixed ranking scale.  The number is absolute in that it tells us exactly how much more production a player generates from his opportunities compared to the average receiver. 


As an efficiency measure,  the impact of high volume receivers is eliminated because ROI is based on rates.  However, to weed out one-dimensional deep threat players, only receivers with reception totals greater than 1 standard deviation below the mean are included (the "Sammy Coates rule").   

Unlike DR, this metric ignores touchdowns because there are many factors contributing to a score that may not be directly influenced by the receiver (play design, downfield blocks, blown coverages, etc).  Not that touchdowns are considered useless, as Reception to Touchdown ratio is also monitored in overall receiver evaluation.

ROI presented below under "Above Average" which shows how much more efficient a receiver is compared to the average Top 150 player in his division (in terms of receiving yards).
Get it?  Got it?  Good...

FBS

Here are the top 20 draft eligible receivers based on ROI efficiency:


  • Top Guns - Higgins and Terry continue to bogart the top two spots; if both stay in school, no doubt they would be the top two WRs in 2021.  
  • Newcomers to list include:
    • Dubois from Virginia - He has been on the list before and showed out with < 50% of receptions yet accounting for about 50% of total yards in the ACC Championship loss.
    • Bradley from Louisiana may have a short stay on the list as his performance in the Sun Belt championship game provided about 20% of the receptions but < that rate for his reception yards.  
    •  Mack is a 6'5" 220 receiver who was a dual-threat QB who also handled kicking duties for his HS team.  I'm not familiar with him but he went over 100 yards in 5 games (including vs. Memphis) and had 7 TDs this year so he will get a closer look.
  • Senioritis - There are only 7 seniors in the Top 20, the highest of which is  Hightower of Boise State who faced off against senior Ward of Hawai'i in the Mountain West Championship game where Hightower's efficiency should get a nice boost with about 14% of receptions with around 29% of team reception yards. Ward had almost identical ratios.

FCS

Here are some of the top ROI receivers in FCS.  We would expect to see extraordinary base production as well as excellent testing for you to see these players on Sundays in the future. 

Weston has a pretty substantial margin of separation from his next competitor, Edwards of Maine; much larger than we've ever seen in monitoring ROI.  

His ROI Efficiency is 308% above average for FCS receivers.  JAC WR Keelan Cole was spotlighted here when he was 333% above average for DII in 2016 but the margin of separation was only about 67%; Weston is over 140% more efficient than the next guy and this is in a more competitive division than Cole (DII Kentucky Wesleyan).
With NFL size and a FCS division-leading TD rate of one every 4.1 receptions, this will be an interesting study.  The feedback I've gotten about Weston from professionals and amateurs has been mixed so it will be especially interesting to watch Northern Iowa games and his pro day performance results. 

FINAL ROI

An update to the FCS, D2 and D3 ranks will be posted when the playoffs for each ends; FBS will be updated upon the end of the Championship tourney. 
Final ROI will be posted when FBS target data is distributed closer to Combine season. 

**************************************************************************


Thursday, December 5, 2019

Week 14 ATS and Review of Week 13

Not in That Particular Order...

Let's look at last week's picks...


Consensus Picks went 7-2
  1. BAL over SF by 3:  Win
  2. WAS beats CAR straight up: Win
  3. BUF wins straight up over DAL: Win
  4. CIN wins straight up over NYJ: Win
  5. CHI over DET by 4:  Win
  6. HOU over NE by 6: Loss
  7. TEN wins straight up over IND: Win
  8. PIT wins straight up over CLE: Win
  9. SEA over MIN by 7: Loss


Interesting point:  we lost both games where we picked the favorite to win...hmm...

Here's this week's picks and pleases, these are for entertainment purposes only.


**************************************************************************


NFL Power Rankings and Strength of Schedule Analysis for the Week Ending 12/2/19 (Wk 13)

Week 13 Rankings!

You should know the drill by now...


Teams are ranked by losses then Diff, which represents the average weighted net total points per game of their opponents the higher the number the tougher the competition.  The Point Differential or "Diff" table is below this section.
 Diff gives more weight to the most recent results as well as W/L percentage.

Notes:

  • BAL remains #1 in my list as well as the Experts Aggregate after a punctuation mark win over SF.  
  • CIN at #32 is also something upon which we can agree although a couple of outlets had NYG as the bottom team.  
  • Risers 
    • DEN jumped 4 spots to #23 after stunning LAC.  The Experts had them at the same landing spot although they had them at #27 last week...weird.
    • BUF jumped 3 to #7 overall with a beatdown of DAL  The Experts had them at #9 but only rewarded them 1 spot. 
    • MIA rose 3 spaces to #28 after waxing PHI, equal with the Experts who had them at #30 last week. 
  • Sinkers
    • NYJ showed the world what it's like to be a fan of this team (like me) by pulling out three solid wins only to give a winless team their first notch of the year...for the second time. They dropped 6 places to #27 while the Experts were more lenient on them, dropping them 2 spaces down to 25.
    • MIN gave the game to SEA on Monday night and that dropped them 4 places to #10 overall.  The Experts only felt that was worth one getting bucked down one spot to 8 (from #7).  
    • NE turned it on in the second half but could not complete the comeback vs. HOU, falling 3 to #5.  The Experts agreed with the same week over week grade as me.

Bullish

  • OAK despite losing to #9 KC, the numbers still point to OAK in the top 15 at #14; the Experts are not so rosy with an aggregate average of 18 overall. Their next test is at TEN which has been on fire. 
  • ARI at #22 ran into LAR and walked away with a loss.  The Experts have them 4 notches down at 26.  This is going to be a tough go for them in the stretch as they face PIT, CLE at SEA and at LAR to end the season.   
  • JAC had an ugly loss vs. TB so I get the Experts having them 4 notches below, but they have  four very winnable games coming up.

Bearish

  • LAC is 4 notches higher according to the experts despite the loss to DEN.   With two games against MIN and KC, ending out the season 50/50 would exceed expectations at this point. 
  • ATL ran into the NO buzzsaw last Thanksgiving and could not pull off the comeback, but they play a go-for-broke CAR team this week, followed up by SF, JAC and the unpredictable TB.

Strength of Schedule

You know the drill...the table represents the year to date adjusted strength of schedule based on margins of victory and loss with the most recent results prioritized. Those of you familiar with the color code know they change with the standard deviation from the mean.  


Notes:

  • CIN took the "top" spot with the most difficult schedule to date, taking over from CLE who dropped to #2 by a couple of hundredths of a point in "Diff" score. 
  • BUF remained the Cupcake Kings with Difficulty Rate of 32.1% (compared to 100% for CIN). The span between them and the #31 CHI is as wide a gap as any.  
  • HOU and BAL both jumped to 10 spots over last week's rankings.  
  • NYJ fell the farthest by dropping 9 for a Difficulty Rate of 54.9%
  • Of the ten most difficult schedules, SEA, HOU, and PIT had winning records.
  • Of the ten easiest schedules only LAC and my NYJ had losing records. 

***************************************************************************

Until next time, check out other articles:

  1. College Football Tackles for Loss Analysis for NFL Draft
  2. NFL - What Playoff Teams are Paying Each Position Vs. Cellar Dweller Teams
  3. College Football Wide Receiver Efficiency Analysis 
  4. NFL - Livin' on the Edge - What Draft Round Produces the Best Pass Rusher Values
  5. NFL - Does QB Aggressiveness Impact Overall Performance? 

Saturday, November 30, 2019

FBS Tackles for a Loss Analysis - Who's #1?

Tackles for a Loss - It's a Question of Who's Second...

In A Few Words

Based on the 11/27/19 statistics, the top defensive players in FBS in terms of adjusted Tackle for a Loss are  as follows:


  • Standard: The NCAA total Tackles for a Loss of 1x solo tackles plus 0.5x assisted tackles.
  • TFL SoS: Grade assigned for aggregate Plays/TFL Allowed rate for opponents with 100% for the least TFL allowed (Army) down to 56.2% (Akron).
  • Adjusted (Adj): Standard TFL adjusted for TFL SoS, giving equal weight to solo and assist TFL and eliminating TFL and plays vs non-FBS opponents.
  • TFL Adjusted:  Adj divided by adjusted number of defensive plays (excludes non-FBS opponents).
  • TFL Score: Scaled grade based on the distribution of TFL Adjusted scores to average using 100% for #1 overall. 
  • Abv Avg::  Percentage above (or below) average. 
  • Std vs. Adj:  Represents the number of places the Adj rating is above (positive) or below (negative) the standard.

Notes:

  • Return of the Mack - Chase Young of THE Ohio State University is no surprise at on an adjusted basis.  He was number 2 based on standard TFL before Strength of Schedule and FCS games were factored in.
  • Fluffy Beaver.- Hamilcar Rashed Jr. is listed on the NCAA official site as having the most total TFL with 22.5 but after eliminating 3 TFL vs. FCS Cal Poly and considering his team faced the 8th most defensive plays for any of the top 32 TFL leaders,  he ended up 3rd overall.  His SoS was 3rd most difficult in terms of not allowing TFL, so that helped.
  • Bullish  - These adjusted scores were the most improved over the standard TFL/Game ranks for the Draft Eligible players (maintaining at least above average scores):
    • Malik Harrison - OSU improved 17 to #12 (from #29)
    • Antjuan Simmons - Michigan State up 17 to #14 (from #32)
    • Shaq Quarterman - The U improved 10 up to #9 (from #19)
    • The biggest riser overall was Jacob Springer of Navy (up 21 to #11 from 32 overall) who is a Junior and will serve his commitment after graduating so we may not see him in an NFL uniform for a while (but given what he's going to give us, that's not really important). 
    • Sean Adesanya of Central Michigan was the highest rising DL who jumped 12 spots to 17 (from #29).
  • Bearish - Not say these players are not top quality, but they saw declines in their places after adjusting their stats.
    • Poor Dom Peterson of Nevada barely made the standard list with 12.5 TFL but losing the 2 he laid down on Weber State was too much to overcome.  He finished last in the analysis with a TFL rate of -78.3% below average.  
    • Quincy Roche of Temple fell 16 places to #29 (from 13 based on standard TFL) because it took him the largest number of plays to reach his 16 total TFL and their SoS was 21 overall.   
    • Max Richardson of BC fell 15 to #31 (from #16)  after excluding the 2.5 TFL he rung up on FCS Richmond and considering his defense faced the 6th easiest schedule to generate TFL against (for teams on the survey).
    • Garret Wallow of TCU also dropped 15 spots to #26 (compared to 11 on the standard scale) after we threw out the 3.5 TFL he put up on Arkansas-Pine Bluff.  He got a bit of a boost with TCU's 5th toughest TFL schedule.
    • Carlton Martial of Troy fell from #6 down 12 spots all the way to #18, also falling from the Above Average to the Below Average (in terms of standard deviation) for eliminating his 2 TFL vs the Fighting Camels of Campbell University...I'm serious...

Conclusion

Obviously every Draft Eligible player on this list will get a thorough film review to understand what each player does well to succeed.  Chase Young is clearly the top option here but the ranking for the rest of the top players, regardless of them being on this list or not, will be interesting to compile. 

*******************************************************************************

DraftTwitter Top 100 Part IV is Coming Up! - We need all contributors to provide their top picks for the 2020 NFL Draft Aggregation - Check out last year here and watch for details on how you can participate.