We have heard NFL media sources state it is premature to judge any draft class until the players have had 3 seasons under their belts. While the 2013 draft class as a whole will be open to scrutiny at the end of the upcoming NFL season since this will be their fourth season and expectations will expect to be met, this article will provide an update of the “EDGE” rusher class of that year.
The Top Prospects
After the 2012-2013 college football season, NFL.com
provided grades for all prospect players.
Here are several of the DL/LB players who come out that year who were
considered “EDGE” prospects:
- Dion Jordan, DE/OLB Oregon – 6’6” 248 lbs. NFL Grade: 93.5. After missing his high school senior season battling injuries from a home fire, Jordan converted from TE to DE his sophomore year at OU. Injuries led to him missing the Senior Bowl. Upside based on his physical tools led to him being projected a Top 5 pick.
- Ziggy Ansah, DE BYU – 6’5” 271, lbs. NFL Grade: 93.8. Another late bloomer, Ansah originally tried out for the basketball and track teams before attempting football for the first time ever in his sophomore year. Despite many obstacles, Ansah worked at learning the game and bulking up to earn a starting job in his final year. Clearly, lack of experience was one of many concerns for NFL teams.
- Barkevious Mingo, DE LSU – 6’4”, 241 lbs. NFL Grade: 92.8. A high school standout at DE, Mingo worked his way up the talented LSU depth chart to have a solid career.
- Jarvis Jones , OLB Georgia - 6’2” 245 lbs. NFL Grade: 88.8. Despite transfer from USC and a season ending neck injury, Jones was a candidate for every major college football defensive category for which he qualified.
- Bjoern Werner, DE FSU – 6’3’, 266 lbs. NFL Grade: 88.2. Coming to America as a high school exchange student with club football experience from his native Germany, Werner eventually committed to FSU where he had a productive career. He passed on his senior year and entered the draft early.
Other top prospects included:
- Datone Jones, DE UCLA – 6’4”, 283 lbs. NFL Grade: 85.6
- Damontre Moore, DE TAMU – 6’4”, 250 lbs. NFL Grade: 87.9
- Margus Hunt, DE SMU – 6’8”, 277 lbs. NFL Grade: 75.4
- Cornelius Washington, OLB Georgia 6’4”, 265 lbs. NFL Grade: 69.4
- Tank Carradine, DE FSU 6’4” 276 lbs. NFL Grade: 85.4
- William Gholston, DE Michigan State 6’6” 281 lbs. NFL Grade: 74.1
- Alex Okafor, DE Texas 6’4” 264 lbs. NFL Grade: 85.2
The Combine
Combine measurable numbers play a significant role in how NFL
teams rank players and construct their draft boards. Of course, because player evaluation metrics
are totally subjective, there is no way to know what one team values more than
the next. Here are the numbers for the
prospects included in the defensive end group at the 2013 NFL Combine (“Pos”
represents the position listed for each player on NFL.com):
 |
| (Note: Because there is no Combine data for Jarvis Jones, who was drafted #17 overall by Pittsburgh, his data is not included in the analyses contained in this article.) |
Ratios Used for Analysis
From the above data, the following measures can be
calculated:
- Density calculated as weight in lbs/height in inches. This permits us to normalize the differences in height and weight that naturally exist between players. This number is best used to compare a player to his position average. Obviously, there will be players outside the average range (within 1 standard deviation) who are impactful players despite being heavier or lighter than the average.
- Vertical Jump to Height ratio (also, “Vert%). The use of raw vertical jump results can be potentially misleading as the point of the vertical is to measure how much power one can generate, not so much how high one can jump off the ground. This measure gauges the percentage of a player’s height he is able to jump off the ground, again, attempting to normalize. The higher the better within that player’s position group.
- Broad Jump Index (also, “BJI”). This measure attempts to measure the “work” a player exerts during the drill to measure power generation (explosiveness). Because a heavier man has a natural disadvantage, the broad jump is multiplied by the player’s Density, resulting in an index number. Again, the higher the better within that player’s position group.
Vertical to Height ratio and Broad Jump Index are graded to
the group average along with 3 Cone, bench and 40 yard sprint times and players
are awarded points as follows:

The total points earned are measured against potential points
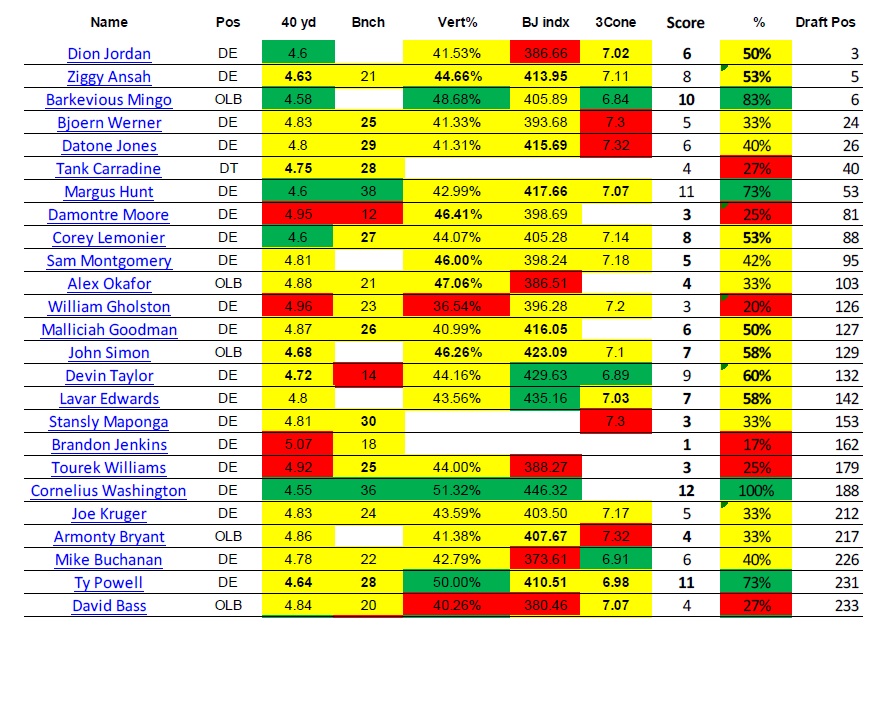
(some players did not perform all drills) for an overall score. For example, Cornelius Washington had a 40
time of 4.55, (compared to 4.63 which is 1 standard deviation from the average)
cranked out 36 reps on the bench (compared to 27.7), had the top Vert% of
51.32% and top BJI of 446.32 resulting in a perfect 12 points out of a possible
12 (I had no 3 cone number for him, so his max was 12, not 15 points). Below are the scores for each Combine
participant based on the performance metrics:

The combine performers with “passing grades” greater than 1
SD above average were Washington, Mingo, Powell, Hunt and Stuart. While other factors go into the GMs’ player
rankings, we would expect to see some correlation with draft position and combine
performance. Here is the table above
sorted by draft position:
 |
| (Note: Walt Stewart was omitted from the list as he went undrafted due to medical issues.) |
It is interesting to see that of the 5 first rounders
analyzed, only one earned an “Exceptional” overall rating from our Combine
analysis. Two earned above average grades
while two were below average. Our top
performer, Washington, didn’t get drafted until the sixth round.
Fast Forward – 2015 Performance
So, ranking of the EDGE rusher group from the 2013 NFL Player
Combine based on our analysis of participant performance did NOT match up very
well with where the players actually went.
Athletic achievement at the combine didn’t translate into the high draft
positions (and the higher salaries) these players had hoped they would
receive. Certainly, the NFL execs, armed
with untold resources and scouting staffs of invaluable experience, have a leg
up on fans and wanna-be scouts alike in this draft thing and knew something we
didn’t. The devil is in the details so
there must be some method of interpreting the Combine data to which we average
yokels will remain ignorant, horded by the NFL GMs. Despite our unsophistication, let us attempt
to close the loop on our exercise by adding player performance through the end
of the 2015 season to the mix. The list below was sorted by “Career Sacks” for the sake of presentation (that is,
there is no particular emphasis on Sacks for this exercise).
 |
| (Note: Players with less than 3 career sacks were omitted from the list.) |
Relative Productivity Metric
From a raw numbers standpoint, it would appear the Detroit
Lions hit the jackpot with Ziggy Ansah.
He’s produced solid numbers anyway you look at them and is becoming a
household name among the NFL faithful.
His numbers standout but how do we compare him to the rest of the field.
And how do we judge players who may
have had a “redshirt” rookie year or have dealt with injuries (Washington )? By comparing the above results to each player’s
participation based on the total snaps played in 2015 (thanks to http://www.footballoutsiders.com/stats/snapcounts),
we get a clear picture relative productivity.

Key:
- Tackles are calculated at 1 tackle for each solo and 0.5 for each assist.
- Snaps/Sack = The number of snaps played to generate one sack.
- S/S% = The percentage of player Snaps/Sack ratio compared to the group average.
- Snaps/T = The number of snaps played to generate one tackle.
- S/T% = The percentage of player Snaps/Tackle ratio compared to the group average.
- Relative Prdctvty = Relative Productivity as the average of S/S% and S/T%.
From the table above, Armonty Bryant is clearly trending to
be the most productive EDGE rusher selected in the 2013 NFL Draft. His
one sack every 35.27 snaps is nearly 10 times that of Okafor’s rate of
one every 659 snaps. Also, he produced one
tackle every 5.71 snaps, nearly 12 times the rate of “Exceptional” combine
performer and #6 overall pick Mingo.
Here’s a final table showing our Combine grades, the draft
positions and Relative Productivity side by side:

It must be acknowledged that there may be any number of unknown
factors that may have impacted the final results of this analysis (players not
reporting injuries at the Combine that hampered performance, depth chart issues
limiting snaps, possible impact on how a player is used within a scheme or sub
packages which could have provided some boost to stats, etc.). Notwithstanding, the numbers would indicate the
three player drafted lowest among the sample had the biggest impact despite
only one having what could be considered an “Above Average” combine performance.
Outperforming Players
- Armonty Bryant (#1 Relative Productivity; Below Average Combine Performance, drafted 217th overall), who attended DII East Central University in Ada, Oklahoma (anyone who can reply and identify what the East Central mascot is, without looking it up, will win a prize of subjective value!) , seems like the steal of the draft for the Browns. But, (sorry CLE fans) this is the Browns we’re talking about. Bryant will miss the first 4 games of the season for violating league rules. It should be noted that back in college, Bryant sold drugs to an undercover cop and was subsequently arrested during practice. (http://www.silverandblackpride.com/2013/4/7/4192900/ecus-de-armonty-bryant-the-true-diamond-in-the-rough) If it’s any consolation, despite being suspended for EIGHT games that year, he racked up 10.5 sacks and 54 tackles.
- Devin Taylor (#2 Relative Productivity; Above Average Combine Performance, drafted 132th overall) played at the real USC where his impressive resume littered with team leading stats didn’t seem to make much noise to many, likely because a kid named Jadeveon Clowney was the talk of the town. Looking back at Taylor, he’s been a leader and winner at every level. He and Ansah will be causing chaos for the Lions for years to come.
- David Bass (#3 Relative Productivity; Out of Range Combine Performance, drafted 233rd overall) produced the highest tackle rate and the fourth highest sack rate despite playing the fewest snaps in the group (only 154 snaps). He attended Missouri Western State (dreaded rivals of Kansas Eastern, I can only assume). It’s clear why he wasn’t recruited out of school. He was only a three sport HS star and named to the All Metro team in the competitive St. Louis area. Who was elected captain of the football team. And the basketball team. Oh, did I mention he was captain of both teams his Junior AND Senior years? He had 7 Passes Defended in his final college season as a Defensive End. That’s as many as first round DB’s Eli Apple and more than Alexander Mackensie(5), Artie Burns (5) and Vernon Hargreaves (4). Drafted by the Raiders, Bass is on his third team (he racked up 3 sacks in 8 games of action during the 2014 season for the Bears before he was cut), he will continue to provide depth to the Titans defensive line.
With some players moving to new teams and others looking to
breakout and make names for themselves (not the least of which being the three
named above), it will be interesting to see how the 2013 EDGE draftees perform
in the upcoming 2016 season.
No comments:
Post a Comment