Mo' Money, Mo Problems
Decisions, decisions. NFL GMs are tasked with spending an enormous amount of money to compile a winning team. Obviously, the salary cap provides an additional challenge limiting the amount that can be spent.
I took the 2018 payrolls listed on www.spotrak.com and compared the average salaries across all positions to the spending habits of the successful teams making the playoffs (contenders) and those who brought up the rear (pretenders).
"Da Numbahs"

Of course since this is based on averages, teams come in at different values around the mean. For example, within the QB average for Contenders we have the lowest QB salaried team (Baltimore) and the second highest (New England). But for the 12 teams making the playoffs in 2018, the average is $17.9MM for QBs. Pretenders spent more for QBs at $18.4MM. But looking at the entire league, both groups paid less than average at the QB position.

The table above shows the percentage above average the test groups spent in 2018.
Here is a graphical representation of the data:

Observations
- "You the Real MVP" - In 2018 Contenders paid way more of a premium than Pretenders for wide receivers, 19.1% more (11.3% above average compared to 7.8% below average, respectively), than any other position.
- Clearly, playoff teams value veteran, experienced receivers who command a higher salary.
- You Don't Have to Overpay the Quarterback - While QB is considered the most important position in all team sports, neither side really broke the bank for signal callers even paying below average in both groups.
- Since this would mean the teams in the middle are paying a premium for signal callers, perhaps the idea that overpaying your QB doesn't leave much money to build around him is true...
- The Rodney Dangerfield Award - Although WRs are valued the most by Playoff Teams in terms of paying premium salaries, the widest salary differential came at the Tight End position and not because the Contenders overpaid. Quite the opposite; they came in at only 1.1% higher than average. It's the Pretenders who really undervalue the TE position coming in at 19.2% under the average league TE salary.
- This represents the largest "premium" the Contenders paid, but, in true winner fashion, they don't have to pay big bucks since the market is undervalued. Schmartz!
- As a Jets Fan, This Particularly Worries Me - The position the Pretenders really valued (or should I say, overvauled) in 2018 was Running Back. If you are an offensive player with a 3 in the tens digit of your uniform, go immediately to your nearest crappy team - they will back up the Brinks truck for you, paying a 19.8% premium.
- Contenders likely look for younger RBs on rookie contracts or scout out talented vets buried in the depth chart to secure a 7.5% discount.
- Cliche, but... - Coaches always tell us, "There are three phases to the game: offense, defense and SPECIAL TEAMS." Contenders embrace this by paying their Kickers, Punters and Long Snappers 5.2% above league average for that position. But do Pretenders listen? No. Pretenders don't have time for those throw away positions...they are too busy collecting bottles and cans to pay for that running back over there!
- The differential on specialists is 9.7%. which, evidently, goes a long way.
- The only other positions Contenders pay a premium for are:
- Defensive Backs are both respected by Contenders who pay 1.6% on of every dollar and disrespected (I cringed just writing that) by Pretenders who have alligator arms to the tune of paying less than 4.9% than the league.
- Offensive Linemen are so close to the mean on both sides with the lowest differential of 1.4% between Contender and Pretender salaries, this obviously comes down to coaching and scouting for the playoff teams to get more for their money.
Position Value Table
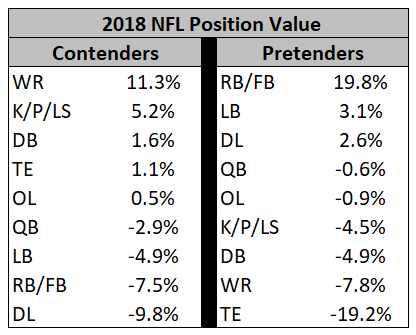
The data on the left reflects the order of importance of position players for Contenders; the right, Pretenders. Everything the Pretenders love to wine and dine (RB/FB, LB and DL) the Contenders take out on cheap dates.
Conclusion
Not sure I can draw a conclusion from these numbers. Last year's survey of salaries by position had totally different results. Perhaps the teams shake up their focus from year to year prioritizing different positions. Or maybe it's all random. Although there is no material statistical correlation between Team Winning Percentage and Position Salary, it seems the winning formula in 2018 lies in the allocation of salaries, which, as always, relies on the talent evaluation and negotiating skill of the GM. Perhaps an analysis of GMs would be a better way to forecast team success. But, that would be boring as hell.
**************************************
Coming up next:
Review of the 2017 People's Top 100 3 years later!
No comments:
Post a Comment