3 Year Check Up
Once a draft is completed, many scouts will move on the a "much too early" analysis of the next class which hasn't even finished the school year at that point. This space is dedicated to back checking draft analyses as well as trying to find patterns that can help us in future draft evaluation.
This piece will look at the 2016 Wide Receiver draft class to see which players put their best foot forward in a relatively short period of time.
The Top
Although there were literally hundreds of draft eligible WRs for the 2016 draft, this piece focused on the 64 prospects graded by NFL.com. Of that group, 32 went on to be drafted with many others latching on as Undrafted Free Agents. Looking at their results to date through two seasons, here are the top performers:
 |
| Grade refers to those listed for each player on NFL.com prior to the 2016 draft. |
- Players were eligible based on an minimum offensive snap total of 475 over the two seasons since the 2016 draft (which number represents 1 standard deviation below the mean); special teams play was not considered.
- The final rank is based not on gross production but on productivity given the following rates:
- Snaps per Target
- Snaps per Reception
- Yards per Snap
- Snaps per Touchdown
- Of the top 6 selected WRs, the 6th, Thomas, and 5th, Shepard, top the list in terms of productivity.
- Two undrafted free agents, Allison and Lewis, finished in the top 16.
- Allison was had the lowest NFL.com rating of any finisher on our list.
- Neither of the two players with the highest NFL.com ratings landed in the top two in terms of productivity.
- Fuller was drafted WR2 and is 6th overall.
- Treadwell, who was argued as WR1, was drafted as WR4 and finds himself at the bottom of the table before the new season begins.
Combine Performance As an Indicator of Future Results
Just as the above group has impressed overall, there are many players from the same draft who will be fighting for their football careers. Some were drafted or graded higher than many of the players on the list above yet have not found success. Now we will look at the combine results of the Top 16 and compare it to the players not on the above list who were either drafted or were not drafted but had higher NFL.com grades than some of the players in the Top 16, which for this analysis, will be referred to as the Underachieving Prospects.
The Metrics
Each athlete was ranked based on their overall performance in the 40 yard dash, short shuttle, broad jump, vertical jump and the bench press. For every event except the 40 and short shuttle, each player was ranked on a "work adjusted" basis, which considers the aggregate mass they moved over a specific distance. Body Mass is just weight in pounds divided by height in inches, ignoring the traditional multiplier for the sake of using simpler numbers for comparison of body types.
Now let's see look to see how the Top 16 and the Underachieving Prospects compare in the Combine events that really show off the difference in each groups' performance.
Body Mass
The average Body Mass of the WR group included in the 64 players graded by NFL.com was 2.79 lbs/in. The measure for the Top 16 WRs was 2.76 lbs/in compared to 2.84 for the 14 Underachieving Prospects. Compared to the mean, only 31% of the Top 16 were above the 2.79 average while 54% of the Underachieving Prospects met that criteria. While the 0.08 difference between the two numbers may seem small, the actual impact would be the Underachieving Prospect being 6.2 lbs heavier at 6'4" than his counter part in the Top 16.

Based on the above graph, it's easy to see the Top Performers were closer to average than the Underperformers (volatility of 2.9% compared to 4.7%, respectively). It is also worthy of note that the lowest performer in the Top 16 was also the heaviest.
Vertical Jump
In this drill, the Top Performers had a higher average of 99.50 in-lbs compared to 96.48 in-lbs for the Underachievers, a difference of 3.1%, the highest differential in any Combine drill between the two groups. 73% of Top Performers reported better than average results, compared to 64% for the other group.

Broad Jump
The averages for the two groups is nearly identical (343 in-lbs for Top Performers and 342 in-lbs for The Underperformers) however the advantage is in the number of players above the line for the Top 16:

Top Performers have 10 of 14 players or 71% above the line, compared to only 50% or 7 of 14 for the Underachievers.
The Other Metrics? Not Much Impact
Beyond these three measures, there didn't seem to be much difference from each group based on the following:
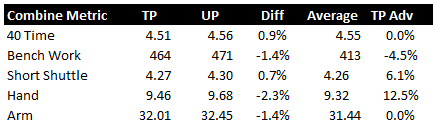
- TP - Top Performer's Average for the Metric.
- Underperformers' results
- Difference is based on TP.
- Average is the mean for the 64 WRs graded by NFL.com for the 2016 NFL Draft.
- TP Adv or Top Performer Advantage is the difference between the better than average player results for TP compared to UP.
The differences in Combine Metircs in favor of the Top Performers group are marginal. Although that group did see more players with better than average hand size and Short Shuttle times; the TP Adv was driven by the difference of one above average player.
Conclusion
While the data sample is being expanded with earlier drafts, the initial indication confirms the conventional belief that the vertical/broad jumps are critical to projecting prospect success.
Shameless Self-Promotion!!!
Follow me on Twitter @boombearjr
or at my Facebook page: Boombearjr Football Analysis (also @boombearjr).
Continue to watch this space for more NFL Draft commentary.
No comments:
Post a Comment