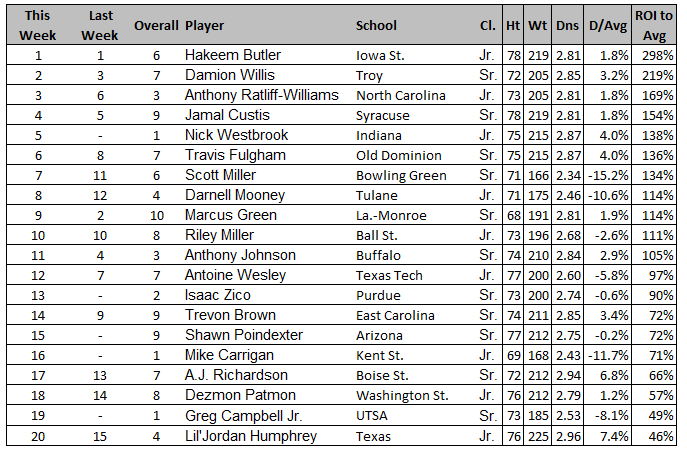
Although this space focuses on the wide receiver position, during this time of year from the bowl season to the NFL Draft, I provide different updates on positions and topics of interest . This week, we are focusing on front seven defenders generating the most tackles for a loss.
Tackles for a Loss - Statistical vs Real World analysis
Although they both require looking at a lot of numbers, keeping score of a game and beginning your player evaluation on the stat sheet are two different jobs. As such, there are variances that should be distinguished when considering how we should measure tackles for a loss:
The "Half" Tackle
Look at any stat sheet for tackles for a loss (TFL) and you will see them listed in increments of 0.5 TFL. That is because, of course, if a player is tackled by 2 players, to give each player credit for a whole tackle would indicate there were 2 tackles on 1 play... If you had shared tackles on every down you could have 60 plays with 120 credited tackles. So, clearly, when players arrive at the same time, they split the tackle for statistical integrity.
But why do we split up the assist tackles when evaluating players? In the statistical world, a player with 10 solo tackles and 10 assisted tackles gets credit for 15 total tackles. But, in the real world, he got "home" 20 times so it is critical that draft evaluation should consider the entire picture. In our analysis, we calculate adjusted total tackles for loss as Solo TFL plus Assisted TFL.
Total Tackles for Loss per Game
Comparing the number of tackles for loss is not an easy business. It is even more difficult when the ratings are based on TTFL per GAME. I think we can all agree that each game will result in a different number of opportunities and so each player's TTFL should be measured against the number of plays the defense faced (in a perfect world, we would have snap count data, but that comes at a cost). Therefore, this exercise measures Defensive Plays divided by a player's adjusted TTFL.
Average Opponent Strength vs TFL
Let's say two players have the same TTFL grade based on our adjustments above. Do we assume they are equal in our early evaluation work? We could, but what I have done below is include a measure for average opponent strength based on calculating a ratio similar to what we have for the defensive players. This players TTFL grade is further adjusted to reflect the competition faced.
Top Adjusted Tackles for a Loss Rating
 |
| Key: Bold Font - Multi sport HS Athlete; Italics - HS All State Athlete; Underline - Legacy Collegiate Athlete, Asterisk - Graduated HS before 2015 |
- Rank - Final TFL rank based on SoS Adj column (see below).
- Std Rank - The standard rank based on half credit for Assisted TFL and using TTFL/Games Played for ranking.
- Mass - A simple measure to quickly normalize player size.
- Plays/Total - The ratio of Defensive plays for players team/Adjusted TTFL.
- SoS Adj - Final TFL ranking based on adjusting Plays/Total for SoS regarding TFL.
Notes
- Michigan State's Willekes was considered #14 for TTFL based on standard scoring however, using our method, he has the best TFL rate in FBS (1 TFL for every 28.95 defensive plays). As a redshirt Junior, I will make sure to take a long look at his game video.
- Harvey of ECU leads the FBS stat sheets in TFL and he is 2nd overall in our analysis, not shabby at all. Further film analysis will be necessary to see how a guy can come out of nowhere to stand at the top of the heap for this important statistical measure.
- Ejiya of the Mean Green of North Texas had the best pure Adjusted Ranking but the SoS UNT faced knocked him down to #6 overall.
- Utah LB Hansen served his Morman mission prior to completing his college career so he is a bit older than most FBS athletes. His numbers were markedly improved based on the SoS having faced so many teams who were stingy in terms of allowing TFL. If he tests well at the Combine, we may be seeing him on Sundays in Fall 2019.
- Gopher defenders Cashman and Coughlin not only went to the same high school, they also ended up with the exact same TFL grade...how weird is that? Anyway, each both rose the highest in the top 25 based on Competition adjustment.
- I know you're asking, who fell the farthest? UNT is on the list again with Brandon Garner taking up that title. Not through any fault of his own, but only because UNT's schedule was loaded with teams that, on average, gave up a ton of TFL, which somewhat devalued Garner's achievements.
Of course, there are so many factors that go into the numbers the best way to evaluate is to watch game footage. The method used here is not designed to give us an unquestionable list but to give us several, "Who?" moments so we can do deeper research on a potential Sunday starter.
*********************************
What time is it? DraftTwitter Top 100 Time! Now is your chance to participate in the annual aggregate top 100 ranking of draft prospects. It's fun, it's free and it's a great way to interact with talent evaluators of all levels. Check out the 2nd annual results to get an idea of what we do and follow me on Twitter for updates on receiving the easy online ballot.
Follow me on Twitter @boombearjr
or at my Facebook page: Boombearjr Football Analysis (also @boombearjr

