Saturday, August 17, 2019

Which Defensive Statistics Most Impact NFL Win Totals?

What matters most on defense?

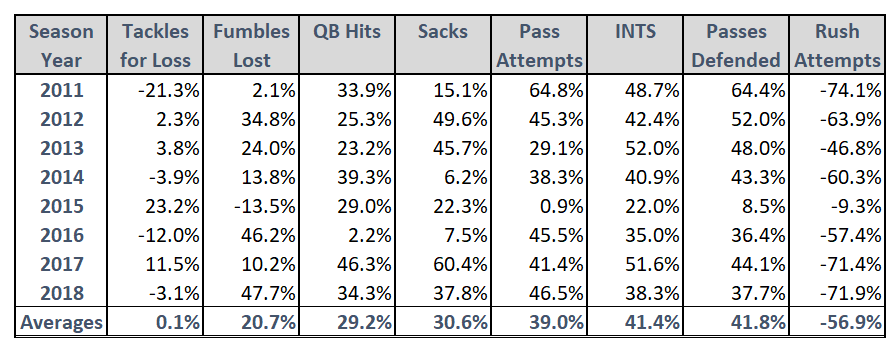
Analytics is effective when it isolates real trends that allow us to better understand what elements help or hurt a football team.  In reviewing the defensive statistics of all NFL teams over the last 8 seasons to see which correlates most directly with team win totals, we get the following table:

Notes:

  • For each year, I compared each team's win total to their totals for each of the individual defensive statistical categories, above.  
    • Each percentage reflects the correlation between that statistic and wins.
    • A positive number means the a higher statistical total contributor to a win, the higher the percentage the stronger the correlation.
    • A negative number would mean that a higher total for that stat has a negative correlation to a win, in effect that stat would be a contributor in a loss.
  • 2015 - The Year of Voodoo  - I have no idea what happened in 2015 but the data seems to be somewhat against the trends for most categories.  QB Hits is the only stat for 2015 that is in line with the average for the 8 season period.
  •  TFL? No Bueno - So, it seems having a lot of tackles for a loss don't necessary correlate to more wins.  In half the years, more tackles for loss had a negative win correlation (that is, greater correlation to a loss than a win).
  • DBU - Tied for the top statistical category with the highest correlation to wins is Passes Defended and Interceptions totals, each with over 41% correlation to wins.
    • With this in mind, it makes sense that DBs have the 2nd highest average salaries in the league (discussed in my player value article; link at the end of the article, below); clearly, they are very valuable to wins. 
  • Stating the Obvious - Keeping in mind we are looking at this from the defensive side of the ball, I think we can see that a high number of Rush Attempts has the most impact on wins with a NEGATIVE correlation on average of 57.4%!  If we removed that pesky 2015, the average would have been closer to 64%.  
    • On the flip side, the correlation with the number of pass attempts a defense sees and wins is near the top end of our scale. 

Conclusion

Although one could argue the old, "Stop the run, run the ball" adage is proven by the numbers above, I can just imagine all the "well, ACTUALLY" folks lining up to state a team winning would run more to kill the clock so we have no indication as to how that team actually got ahead.  But, because at the end of the game a team stacks up run attempts to close out the win, a strong correlation for defenses losing when giving up more run attempts (and winning when the opponent passes more) is evident. Perhaps, but to confirm, let's look at the table with Passing and Rushing Yard totals correlation to win totals. 


Well, actually, when you compare the wins to Passing Yards and Rushing Yards, it's clear the negative correlation is much stronger and consistent year over year (curse you, 2015) when a team gives up more rushing yards  than it is with passing yards.

So, run the  ball and stop the run, as boring as it seem on the surface, is the statistically sound way to play the game.  
Looks like the old crazy football guys know what they are talking about.  Go figure.

*************************************************************************

Moneyball Football Style!  Click here to read how the "Contenders" and the "Pretenders" spent $$$ by position in 2018...


Wednesday, July 31, 2019

2019 NFL Win Over/Under Total Predictions!!

Going Head to Head vs Vegas, Baby!!


The preseason begins TODAY and here is my totally numbers driven stab at providing baseline 2019 over/under wins projections for each NFL team. 

Here is a brief step by step overview of how the numbers were crunched:

  1. Take last year's Points For ("PF") and Points Against ("PA") totals for each team.
  2.  Use an actual 2018 Strength of Schedule ("SoS") list of your choice to find the correlation between it and each of the above.
  3. Based on this correlation, break out the portion of 2018 totals for each team into "Team Portion" which represents the amount of PF and PA generated by the team through their talent, coaching and scheme and the "SoS Portion" which represents the impact of the opposition's resistance.
  4. Apply a Rating Scale based on the distribution to give simple grades like in school (Top Team earns "100%" grade,  teams below the mean by more than 1 standard deviation earn "67%" or less).
  5. Conduct the same exercises for 1-4 above using the 2019 "SoS" projections of your choice.
  6. Find the difference between the Actual PF and PA Ratings and their corresponding projected values; this is your adjustment to the "SoS Portion" in #3 above.
  7. Add up your projected 2019 "SoS Portion" with the 2018 "Team Portion" (this is unadjusted for personnel or scheme philosophy changes that may have occurred over the off-season).
  8.  Find the difference between the PF and PA and divide by 16 games to give you the 2019 per game Margin of Victory.
  9. Divide the 2019 MoV by the 2018 MoV to get the change in 2019 games.

The table below shows the results

2018 Actual - Duh.

2019 Projected - Shows the win total using the method outlined above.  "+/-" represents the increase or decrease in wins projected for 2019 over 2018.

Vegas W - Shows the number for wins posted on www.oddsshark.com


Notes:

  • Obviously, there are no half wins but this projection is in line with the Vegas win over/under numbers below; the recap at the end of the season will round the numbers for comparison.
  • Denver moves up the most whole games from 6 to 9.5 (10).
  • Tennessee looks to fall off a cliff going from 9 wins to 2 in our analysis...dang. Looks like going from the 13th easiest schedule to the 4th most challenging could take its toll.
  • Bullish compared to Vegas: 
    • New Orleans +4 (14 vs 10 Vegas over/under)
    • LA Rams +4 (14 vs 10)
    • Miami +4 (8.5 vs 4.5)
    • Chicago +3.5 (12.5 vs. 9)
    • Houston +3.5 (11.5 vs 8)
    • LA Chargers +3 (13 vs 10)
  • Bearish compared to Vegas:
    • Tennessee -5.5 (2.0 vs 7.5 Vegas over/under)
    • San Francisco -3 (5 vs 8)
    • NY Jets -3 (4.5 vs 7.5)
    • Cleveland -2.5 (6.5 vs 9)
    • Green Bay -2 (7 vs. 9)
  • Based on the above, here are the Division placings:
    • AFC East:  NE, MIA, BUF, NYJ
    • AFC North:  BAL, PIT, CIN, CLE
    • AFC South:  Tie HOU and IND, JAX, TEN
    • AFC West:  Tie KC and LAC, DEN, OAK
    • NFC East:  PHI, DAL, WAS, NYG
    • NFC North: CHI, DET AND MIN (Tie), GB
    • NFC South: NO, CAR, ATL, TB
    • NFC West:  LAR, SEA, SF, ATL
The above exercise was fun but the outcome is not at all sensitized with all the factors that the oddsmakers layer into their projections.  But does that even matter?  We'll find out at the end of the 2019 NFL season when we recap our results. 
Don't forget to leave a comment.  

Happy NFL Day and have a great season (unless you are a Patriots fan)!

**********************************************************************

Check out my analysis of the Wide Receivers from 2019 NFL draft based on Dominator Rating (DR) compared to my Efficiency finding ratio, ROI HERE.

Shameless Self-Promotion!

Follow me on social media at @Boombearjr on Twitter  and Facebook


Friday, July 19, 2019

2020 NCAA Wide Receiver Draft Class Dominator Rating vs "ROI"

FBS Just Over One Month Away!!

Football action is around the corner and I wanted to follow up my "NFL Rookie Dominator Rating Vs Return on Investment" article with the same analytical peek at the upcoming FBS season comparing many of the top seniors and underclassmen likely to declare for the 2020 draft wide reciever class.

Briefly, Dominator Rating, or "DR" measures the average of a player’s percentage of team receiving yards and percentage of the team's receiving touchdowns. 
Return on Investment or "ROI" seeks to uncover just what the name implies...if I invest a passing target in getting the ball to a receiver, what kind of output in terms of production am I going to get from him?  

For more detail into each of the metrics we will discuss, please refer to the original article referenced above. 

DR vs ROI


The table below is organized as follows:
  • Player Name, Team and Class
    • "r" means redshirt
    • "T" means transfer
    • "MM" means player served a two year Morman mission
    • JUCO prefix indicates the number of years at his current school post JUCO
  • Height (inches), Weight (lbs) and Density (Dns) -Simple density calculated as Wt/Ht
  • DOM = Dominator Rating as detailed above. 
    • Score: Based upon the distribution of all sample scores based on an "A to D" grading system with 100% awarded to the top scorer and a 65% assigned to the score at the bottom of the range 1 standard deviation below the mean. 
  • DOM w/o RB = Dominator Rating excluding RB statistics (to provide an "apples to apples" comparison to ROI which eliminates those same stats).
    • THE TABLE BELOW IS SORTED BASED ON THIS METRIC.
  • ROI = Return on Investment is as detailed above. 
  • Diff = Difference between DOM w/o RB and ROI.
    • The lower the number the more parity between Dom w/o RB and ROI; the larger the more disparity.
  • Rec/TD = Number of receptions to generate 1 Touchdown


What's With All the Colors?  

The numbers in the table above are exclusive to their respective columns so a 25% score in one column is not the same as a 25% score in the others. Each metric was sorted independently based on the distribution:


Consensus -  The eye naturally lands on rows where the color and font are the same in all three categories, which indicates DR and ROI agree. Here are the favorable players who meet that standard.
  • Superior:  One name stands above all and that is Tulane's Darnell Mooney.  If you've never heard of him, that is the point of ROI, to screen out guys who may get lost in the draft hype machine.  While his numbers show he dominated and was the most efficient in FBS, film study is required to see if that was because his teammates were truly, truly below NFL level prospects or if he will back up his numbers with solid execution and mastery of fundamentals. 
  • Outstanding:  Louisana Tech's Adrian Hardy was a high school QB and you know I love receivers who were signal callers. His ratings were consistent across all three metrics so I will make sure I take the time to really check him out this coming season. 
  • Above Average:  MSU Bulldog Isaiah Zuber (formerly of  Kansas State), Kentucky's Lynn Bowden Jr. (former QB), Cornhusker JD Spielman (Minnesota Vikings GM Rick Spielman's son, so he has NFL access)  and college journeyman Kirk Merritt of Arkansas State are all bold yellow across the board.
Disparity - There can be a lot of variance between DR and ROI for an individual player.  To eliminate the noise, we will focus on two criteria to see who has the most divergent scores:
  1. In terms of DR w/o RB and ROI, the player has one above average (Blue, Green or Yellow Bold) and another below average (Yellow, Orange or Red) and
  2. There must be a difference of at least two grades between them.
DR Favorable/ROI Unfavorable


  1. Rice's Austin Trammell has a Dom w/o RB that is indicative of a late 1st round pick but his ROI is subpar based on the data.  He has come away with all-Conference USA hardware each of his first two years so we'll see what he can do in 2020.
  2. Jalen Reagor of Texas Christian  is a legacy player, his father having won a Super Bowl ring with the Colts.  He is showing Top 20 pick with his DR w/o RB but his ROI is two levels down which indicates he may have had over-distribution of targets last year. 
  3. Washington Huskie Aaron Fuller , the lone senior of this group, was the leading receiver for UW evidenced by his high DR w/o RB but his performance overall was distinct from the rest of the team but not in a positive way, as far as ROI efficiency is concerned. 
The three receivers above are special talents,  however the disparity between our metrics needs to be investigated with review of game video to see what is up. 

ROI Favorable/ DR Unfavorable


  1. Dezmon Patmon of Wazzu was third on the team in terms of receptions which resulted in a disappointing DR w/o RB however he led the team in receiving yards.  That helped put him near the top of our list in terms of ROI. It will be interesting to see if Mike Leach increases his targets given his superior efficiency. 
  2. Nick Westbrook of Indiana makes me wonder how a 1st team all-state receiver out of Florida...FLORIDA...decided to spend his college career at Indiana, a school not known for football.  His injury 2 years ago may have been a blessing in disguise, permitting him a redshirt senior year in 2019. I was a huge fan of his last few years and I know he will become one of the more talked about "sleeper" names in the 2020 draft process. 
  3. USC's Michael Pittman is, indeed, the junior of the former NFL Super Bowl ring wearing running back. No slouch in his own right,  Deuce certainly made use of his NFL access evidenced by an All American high school career.  His marginal DR  is driven by being 3rd on the team in receptions in 2018, his outstanding ROI by efficient production.  USC is loaded at WR with Vaughns and St. Brown (1st and 2nd in 2018 receptions) so we will see if Pittman can further distinguish himself. 
Receptions/Touchdown

Unlike DR, ROI does not take into consideration receiving touchdowns because there are many factors involved beyond the receiver's skill.  As an additional aid, it is helpful to check TD production through receptions/TDs.  


As you can see, the above-average REC/TD ratios have no correlation to DR w/o RB or ROI as it is independent of both metrics:
  • DR includes player's percentage of team touchdowns it can be misleading; Army had 7 passing TDs in 2018 with 4 going to Jordon Asberry for 57.1% of team touchdowns.  Couple that with his 21.0% share of team receiving yards and he's a late first round pick with a Dominator Rating of 39.1%.
  • Across the range from above average (Blue, Green and Bold Yellow) to below aveage (Flat Yellow, Orange and Red) the distribution in the table above resembles the protoypical bell curve. 
  • I believe a better way to evaluate TD contribution is apart from any reception/yardage measure by using the REC/TD ratio.
  • One observation that is interesting is many of the top "brand" name WRs in this coming draft go into 2019 with DR w/o RB and ROI hovering around average but boasting elite REC/TD ratios. 
    • It will be interesting to see how these players perform in the upcoming year to see if the productivity/efficiency numbers increase to the level of their TD generation.
    • It bears noting that Alabama's Jeudy (discussed as a possible WR1 this coming draft)  got the only Outstanding REC/TD ratio with a TD scored every 5.09 receptions. 

In Conclusion

While the numbers can be similar for a player across the three primary metrics we reviewed, Dominator Rating, Dominator Rating without Running Back stats and Return on Investment, it is critical to compare them exclusively within each data set.  Just as Dominator Rating is not infallible, neither is ROI.  In fact, ROI is best used as a screening tool to find players who may have been overlooked by the media draft machine; especially given how REC/TD and not Dominator Rating seems to be more line with the players receiving media buzz this pre-season.

Keep an eye on this space for updates all NCAA season long for FBS receiver ROI trends with periodic review of FCS, DII and DIII top ROI receivers.

***********************************************************************

Shameless Self-Promotion!

Follow me on social media at @Boombearjr on Twitter  and Facebook


Wednesday, July 10, 2019

2019 NFL Draft Wide Receiver Review - Dominator Rating vs. "ROI"

NFL Action in Less than 1 Month!

NFL football kicks off August 1st when Denver takes on Atlanta in the first preseason game of 2019 and so it's a  great time to review some of the NFL's newest players selected in the Player Draft held this past April.  

This space focuses on receivers and so we will take the time to compare and contrast players drafted based on the following performance metrics:

Dominator Rating 

Dominator Rating, or "DR" measures the average of a player’s percentage of team receiving yards and percentage of team receiving touchdowns.  From online sources, this concept was brought to the internet mainstream by the guys at Rotoviz.com.  They admit the Dominator moniker is not a promise the player will dominate at the next level, but an apt description of how the player dominated his team's passing game.  A DR > 50% would suggest NFL superstar potential (top 10 draft pick) for a prospect, 40%-50% would suggest a player worthy of a top 20 pick, 35%-40% indicates late first round,early second, and so on.
In looking at evaluating receivers I felt such a measure would be great at isolating potential NFL prospects for further review...but something didn't feel right.  Just because a player was targeted more frequently, did that mean he was the best player on the field in the passing game?  Maybe he was the guy because he it was his turn as a senior or maybe the coach just liked him or maybe he had the hype going into the season and running the passing game through him would keep the team on the news. And there were rarely diamonds in the rough to uncover with DR...the players were widely know because they were at the top of the stats columns.  A guy could be responsible for 50% of his teams receiving yards and receiving TDs but maybe they were force feeding him and there were other, more efficient options available who were outside the limelight. But how would you find those guys?


Return on Investment

Return on Investment or "ROI" seeks to uncover just what the name implies...if I invest a passing target in getting the ball to a receiver, what kind of output in terms of production am I going to get from him?  Starting with the basic concept of the DR, the percentage of his team's receiving yards a player generates, ROI goes deeper,  comparing also the percentage of his team's receptions the receiver converts from his targets.  The player's Return on Investment is compared to other players and, unlike DR, the players are tiered based on distribution using standard deviation; therefore, there is no fixed ranking scale.  The number is absolute in that it tells us exactly how much more production a player generated from his opportunities compared to the average receiver. 
As an efficiency measure,  the impact of high volume receivers is eliminated because ROI is based on rates.  However, to weed out one dimensional deep threat players, only receivers with reception totals greater than 1 standard deviation below the mean are included (the "Sammy Coates rule").   
Unlike DR, this metric ignores touchdowns because there are many factors contributing to a score that may not be directly influenced by the receiver (play design, downfield blocks, blown coverages, etc).  Not that touchdowns are considered useless, as Reception to Touchdown ratio is also monitored in overall receiver evaluation.  

DR vs ROI

So let's compare receivers drafted in the 2019 NFL Player Draft based on these two measures.  First let's look at the top DR players (the numbers below exclude RB statistics which is a requirement for ROI).


Round = NFL Draft Round selected; Overall = Overall Pick. DR=Dominator Rating; ROI = Return on Investment


The players are ranked based on the distribution with the color code key, below:


The table above shows the top-ranked receivers by DR starting with Andy Isabella at 52.1% going to the bottom tier of the range of 30% (held by undrafted Terren Encalade of Tulane).

From the above, there were 32 FBS players in the 2019 draft with DRs > 30%.  

  1. Of those, 13 were drafted with an average draft position of 135.1 (40.6%).
  2.  Twelve were offered contracts as Undrafted Free Agents (37.5%).
  3.  Seven are still awaiting NFL opportunities (21.9%)
  • Isabella projects to be of superstar ilk, based on DR alone. 
  • Of course, many factors go into player selection, but when it came to mapping DR to draft position, Marquise Brown nailed it by going late 1st rounder with a DR of 35.2%.
  • Jamarius Way, who has good size at 6'3" 215 lbs was the highest DR player (39.1% for late 1st/early 2nd round consideration) to go undrafted, possibly hindered by a less than spectacular Combine and coming out of a small program.
  • Players who were consistent in terms of tier ranking for both DR and ROI are:
    •  Outstanding:  Hakeem Butler
    • Above Average: Antoine Wesley, Marquise Brown, Travis Fulgham, Marcus Green and Johnathan Boone. 


Now let's take a look at this from an ROI perspective:


Per the Sammie Coates Rule, the list above excludes players with less than 42 receptions, so some of your favorites may be missing. 


The table above shows the top-ranked receivers by ROI starting with Damion Willis (6'3" 204 lbs)  formerly of Troy who provided a return of 58.1% more production than expected based on his share of targets, receptions and yards. ROI considers all receivers greater than 1 deviation above the mean (compared to the 30% cutoff for DR)  so Marquise Brown rounds out the list with 15.1% ROI.

From the above, there were 25 FBS players in the 2019 draft with above-average or better ROI .  
  1. Of those, 11 were drafted with an average draft position of 147.2 (44%).
  2.  Eleven were offered contracts as Undrafted Free Agents (44%).
  3.  Three are still awaiting NFL opportunities (12%)
  • CIN also picked a high ROI and DR players in Tyler Boyd and Josh Malone so it's no surprise they went with Willis. 
  •  The highest ROI guy not on the DR list is Olabisi Johnson who was drafted in the 7th round.
  • Interestingly, the three who are not currently on teams qualified for both the DR and ROI recognition tiers (Campbell Jr, M. Williams and Boone) - maybe one will get a shot to latch on somewhere. 
  •  There are eight ROI players who did not make the DR list:
    • Drafted: Johnson (#247), Jennings Jr (#120) and Arcega-Whiteside (#57).
    • UDFA: Custis, Richardson, Poindexter (a poor man's Arcega-Whiteside given development), Ratliff-Williams and Murray.
  • Two of my personal favorite prospects, Miller and Butler, were the only two to generate Outstanding of better tier rankings for both DR and ROI. Looking forward to see if they show and prove this year. 

What's the Difference?


The table above shows the players who have at least a two tier difference between their DR and ROI that carries then over the mean.  There is nothing scientific about this table but it will be interesting to see who succeeds and who fails when it is all said and done.  The guys in orange background are favored by DR but below average in ROI while the opposite is true for green.


Conclusion

The point of this comparison is not to prove any metric "right" or "wrong" but to set a basis to track results that could lead to fine tuning both these metrics for better predictive results.  It will be a lot of fun comparing the two over the years and I hope you will come along for the ride.

***********************************************************************

Shameless Self-Promotion!

Follow me on social media at @Boombearjr on Twitter  and Facebook
Wednesday, June 12, 2019

2018 NFL Impact Receiver Measures

Potential vs Impact

Those of you who follow this blog understand the use of efficiency measures as early identifying tools for screening out college players with potential.  Efficiency shows who has made the most of the opportunities they have been given but they don't always show the gaudy baseline statistics fans look for.   I've developed a way to quantify efficiency through the Return on Investment metric which has screened out players such as Ken Golladay, Cooper Kupp, Keelan Cole, Josh Reynolds, Keke Coutee, and others before they became more commonly known. 

But now that we've identified potential, once they get to the big time, what's next?

Impact. 

Impact for our purposes is measured using three metrics:
  • Yards per Target
  • Targets to Touchdowns ratio 
  • Yards After Catch to Air Yards ratio
After analyzing 2018's Top 100 players in terms of receptions  (excluding RBs), here are the statistically elite players (greater than 1 standard deviation above the mean) for each category:

Yards per Target (Average 8.44 YPT)


  •  Top Gun Tyler Lockett produced Yards per Target at a rate 63% better than average (8.44 Y/T) and 25% better than the number two man, Mike Evans. 


  • George Kittle represented Tight Ends on the list, showing results 20% better than average.
  • Two members of the elite performers will likely not be playing in 2019 so we will see how that impacts the Chiefs and Parriots going forward.


Targets per Touchdown (Average of 1 TD every 23.13 Targets)

  •  Mike Williams did not blow it up in terms of gross receptions or yards but he scored at a faster clip than any player in the data group after taking. medical redshirt his rookie season.


  • Calvin Ridley was #5 on the list, but his TD production exceeds his teammate Julio Jones' who needs more than twice the number of targets to keep pace.
  • The slowest Targets per TD rate was a Raven who scored at a rate of 1 touchdown every 95 targets . 


Yards After Catch to Air Yards ratio (Average of 0.65 YAC/AY)


  • Engram dwarfs the competition with a ridiculous 2.05 yards after the catch for every air yard.


  • Not surprising, the top 3 players are Tight Ends who combine size and speed; both Kupp and Moore were human freight trains in college, so no surprise to see them with their physical running styles on this list.
  • Of the top 10 players in terms of gross YAC, only Kittle (who  registered the highest YAC total for 2018) was a standout in terms of YAC/AY ratio comparison. 
  •  The man with the most "upside" is a long, lanky receiver on Carolina who had a ratio of 0.16:1; he eeked out 1 YAC every 6.25 Air Yards.  That's basically falling down after the catch.

Your Impact Players 2018

We gave every player a grade in each category and ranked the aggregate scores awarding letter grades from A to F with he top performer earning 100%  and grading each subsequent player based on the differential in score compared to #1.
The 3 rankings were averaged and the same differential grading was implemented to simplify  the rankings.
Tier I equates to an A+ (100) through A- (90) grade.
Tier II equates to a B+ (89) through B- (80).
Tier I
  • Lockett was the #1 overall Impact Receiver for 2018;  we should expect to see his gross numbers increase given the retirement of Doug Baldwin. 
  • Kupp is in the conversation at #2. What's more, the differential between his score and that of the third place player is 4.2%, the largest margin in the survey.
    • Which is about twice as large as the next largest margin between any two consecutive players.
    • And is about 10x larger than the average margin between players scoring 80 or higher. 
  • Hollywood Higgins is proving to be a solid component of the Browns offense and it will be interesting to see what effect the revamped CLE receiving corps has on his performance. 

Tier II
  • TB led the NFL in Passing Offense in 2018 and has FOUR Impact receivers in Tier II, the most from any single team across both Tiers I and II.
  • Watkins will be one to watch in 2019 as KC's wide receiver situation gets a bit murky. The opportunity could not have been set up any better for him to take a more meaningful role in what looks to remain a high powered offense.
  • Missing in Action: Teams not represented in the top two tiers: BAL, BUF, CAR, DAL, DEN, DET, MIA, TEN, WAS
  • NFC West is the only division fully represented across the top two tiers.

 Outside Looking In

The following players were below the 70 points or "low C" mark:
  •  Crabtree, BAL :  63.6%
  • Landry, CLE:       62.8%
  • Reed, WAS:         62.1% 
  • Doctson, WAS:    61.6%
  • Graham, GB:       61.3% 
  • Gabriel, CHI:      58.7%
  • Wright, CAR:      57.2%
  • Amendola, MIA: 55.5% 
  • Snead, BAL:        55.4%

  • With no player higher than mid "C" level (John Brown), we'll see if the Lamar Jackson experiment in BAL takes off in 2019.
  • WAS is also represented twice in the bottom tier and they are hoping they can get McLaurin and Harmon going at WR especially with that murky QB situation. 

Check back during the season for Impact updates of which receivers are contributing at a high level for their teams. 

***********************************************************************

Shameless Self-Promotion!

Follow me on social media at @Boombearjr on Twitter  and Facebook


Wednesday, May 29, 2019

NFL Draft 2019: Who's Screwed Wrap Up


Wrapping up the 3 Part Series

During the 2019 NFL Draft, we tracked each teams’ progress toward picking up players at positions of need.  That’s not such a big deal, right?  Until you start tracking the impact of each player coming off the board before your pick on your ability to meet your teams’ needs.  In the first round, five DE’s flew off the boards…how did that impact the overall supply for the teams who waiting in line desperate of pressure off the EDGE?  Were there enough “quality” DE’s to ensure each team with need got their guy?

We left our pre-Day 3 analysis without reconciliation of how teams in peril of not filling needs ended up at the end of the draft.  Today, we determine conclusively, who’s screwed going into the 2019 season.
Methodology
In summary, we took each NFL team’s top 5 draft needs (ranked from 5 for greatest to 1 least critical) and counted the total number of each position in the top 160 players. 

So, if there was a need for 15 cornerbacks and we counted 10 in the top 160 prospects, the position would be considered a “Critical Position” because there is a 50% deficit of talent to fill the needs. (For detail on the methodology, please follow this link.)


Hit the Phones

These teams either had just enough picks remaining to secure quality prospects for their several Critical Priority needs or their needs were not that urgent.


ATL:  Began Day 3 with Critical Priority Needs at DL (5), CB (3) and LB (2)

Result: 2 out of 3
The Birds used their first pick of Day 3 to address CB depth with Kendell Sheffield of OSU to provide support for Desmond Trufant and Isaiah Oliver.  They then went on to meet their “most critical need” (rated a number “5”) at DL in the form of 6’4” 286 lbs John Cominsky at #135; he has been wreaking havoc at Charleston for the last few years. He immediately adds to an already stout DL rotation.  While I like the Cominsky pick, the team decided not to draft a LB which is not dire since it was a low priority position.  Can’t say I know their backers, but the DLine and defensive backend are both pretty solid.


DAL:  Critical Priority Needs: S (4) and TE (3)
Result: 1 out of 2
While the team picked up two members of The Jacksons (including Papa Joe, one of my sleepers) before addressing the need at safety, they waited until # 213 in the 6th to grab Donovan Wilson (formerly of TAMU), the 11th safety picked that day.  Definitely outside the window of the Top 160 players from our 3 sources, but in this exercise, we just check to see if they address the need before the Top 160, not if they actually pick one from our list of Top 160 players.  Evidently, in Witten they trust because the team didn’t draft any TE despite the pretty obvious need.


NE: Critical Priority Needs: TE (5), DL (4) and S (2)
Results:  1 out of 3
Always the “Get off my lawn” guy of the league, the Pats don’t surprise by refusing to take a TE this draft despite the position being listed as their top priority. Veteran TEs Ben Watson and Austin Seferian-Jenkins will have to hold down the fort this year for the Pats. When it was time to go DL, NE used their 3rd pick of the day to grab Bryon Cowart of Maryland at #159 overall.  This is so Patriot-esque. They took the former top #1 recruit in all of HS football who underperformed mightily in college and was long forgotten by the mainstream.  This is a classic Patriots move; he is all but assured a bust in Canton after Belichik works his mojo on him.  While they picked the need position within the top 160 spots, Cowart was not considered a Top 160 player. And, for their final need of safety they just ignored the position. Hey, who needs safeties anyway?  Especially with McCourty in the last year of a large contract – what’s the problem?  But that’s the Pats.  They make moves like this and still win, so…


NO: Critical Priority Needs: LB (3) and CB (2)
Results:  1 out of 2
First off, the Saints went into Day 3 with not a lot of firepower in terms of draft capital.  However, when you look at their depth chart, there are not a whole lot of pressing needs for the team.  Regardless, they made a couple of trades and, as a result, they added LB depth through Idaho’s Kaden Elliss, whose dad was a 2x Pro Bowler; they didn't feel a lot of pressure as they got him way outside the Top 160 picks (#244).  Depth at CB was not a front office concern as the team didn’t draft any corners.


NYJ: Critical Priority Needs: CB (3) and TE (2)
Results:  2 out of 2
While I was not convinced the need was there, the Jets agreed with the league by picking up a TE in the 4th round at #121 overall, Trevon Wesco from West Virginia, making him their 6th TE on roster (currently trimmed down to 5). At #196, they fulfilled their CB need with Blessuan Austin from Rutgers who has a history of injuries and has missed significant time over his college career; the NYJ doctors evidently gave him the all clear. While there were several CBs drafted after #196 who are capable of participating Day 1, that the Jets GM was fired post draft, shows me their draft can be entirely tossed out in terms of grading.

Start Pointing Fingers

These guys were under the gun with Criticality scores > 100% which means at least one high priority need will likely not get picked because a team has too few picks.  

PHI: Critical Priority Needs: LB (5), S (3) and CB (2)
Results: 0 out of 3
The Eagles couldn’t care less about our little project…Linebacker?  No thanks.  Safety?  Defiant still, they reject the notion of drafting a safety.  The CB cupboard seems stocked right now but there are 4 CBs going into free agency in 2020 and the Eagles salary cap situation looks pretty rough for next year so bringing on a rookie CB to groom would have provided flexibility.

SF: Critical Priority Needs: S (4), CB (3) and DL (2)
Results: 0 for 3
I’m not going to lie, it looks like the Niners have put together a nice roster based on the current depth chart but I don’t know if you start out the day picking a punter.  He may be All-World but they likely could have traded back and still gotten him.  Regarding safeties, they only have 2 coming up for free agency in 2020, so they decided to stand “pat” on their top “priority” position.  They also would not be bullied into rushing to pick a CB, what with Richard Sherman added to the squad to complement Ahkello Witherspoon, so they waited until #198, their last pick of the day to call in Tim Harris out of Virginia. Given neither of their backup DTs participated in more than 25% of the defensive snaps, I can see why perhaps they wanted to increase depth with another guy in the rotation, but they stood pat here, again.  We will see how this all fares for the Niners in 2019.

Polish up the Resume

Although the worst Criticality score that can be calculated is 500%, these teams have been assigned a score of 501% which means they were screwed because they have no remaining quality picks (top 160) with needs multiple needs remaining.

KC: Critical Priority Needs: LB (4) and CB (3)
Results:  1 out of 2
It all started with the decision to use their 3 top 84 picks on WR and S (both had a surplus of acceptable prospects at the time and selection of these positions could have been delayed) and DT, the latter being a timely pickup since the shortage at this position was its worst at the beginning of Day 2.  They struck for a CB with the 201st pick in Rashad Fenton (GO COCKY!!!) so while they didn’t get one of the top propects at CB, they filled the need with a solid player.  Although they chose not to look at LB, now that we know they had an offer on the table for former 1st round pick Darron Lee (recently traded from the Jets), it makes sense they took no action.  Looks like it turned out for them after all.

LAR: Critical Priority Needs: DL (4) and LB (1)
Results:  1 out of 2
So long, Suh and that means Donald and Tanzel Smart (who sat nearly all of 2018 behind Suh) needed some help in the depth department at DT, a position with a critical deficiency of quality players to draft.  After several trades with the Patriots (please see below), they took a liking to Greg Gaines and got him within the first 160 picks at 134.  They took the 243 pick (also from NE) and picked up LB Dakota Allen, the last backer picked in 2019. 


Wrap up:  While many teams filled their priority spots, several were not able to address those we deemed critical due to lack of top tier talent to fill those needs.  If a team was not able to address their critical positions within the first 160 picks, we worry about talent quality at a position of need.  But we will have to wait until the end of the upcoming season to see which teams got it right and which teams should have pulled the trigger faster.  The wins and losses are the ultimate validator of who is a contender and who is a pretender.  


Bonus commentary:  What is up with the Rams and Patriots trades?

These two teams pulled off 3 trades on draft day: 
  • Pats get #45; Rams get #56 and #101
  • Pats get #101 (!) and #133; Rams get #97 and #162
  • Pats get  #162 (!) and #167 ; Rams get #134 and #243
The exclamation points indicate some Looney Toons stuff going on here.  Did the Rams just send back 2 of the picks they got from the Pats, thereby negating the impact of those selections on the overall outcome?
Let's cross multiply:
  • Pats get #45; Rams get #56
  • Pats get  #133; Rams get #97
  • Pats get  #167; Rams get #134 and #243
No idea how to look at this trade for value.  If I look at the contract values at those slots, I get the Pats got about a 15% premium per player. Can any of you draftniks provide clarity?


*******************************************************************

Check out the 3rd Annual People's Top 100 - NFL Draft 2019