Friday, October 9, 2020

NFL Cornerback Performance Thru Week 4 with look at Week 5


Cover Me

Cornerback is one of the most impactful positions on a football field.  A great one can eliminate the opponent's best receiving weapon and a bad one is a liability that can throw the entire defense into chaos.  

A couple of weeks ago, due more to lack of any college football wide receiver data to crunch with the NCAA season still getting off the ground, I started poking around at NFL cornerback numbers.  I'm no aware of any regular commentary floating out in cyberspace that focuses on this unsung position  where the goal is to be so good they never call your name.  

I started looking at three metrics to try to give context to the statistics:
  1. Attack Ratio:  Total Targets/Total Snaps - The lower the better.
  2. Bleed Ratio:  Total Yards Against/Total Snaps - The lower the better.
  3. Burn Ratio:  (Total Interceptions/Total Snaps) minus (Total Touchdowns/Total Snaps) - The higher the better.
Each metric is stated as a Z-score (# of standard deviations from the mean) which is then averaged for a final score.  The player data is aggregated on a team basis so we can see how the individual performances impact the team as a whole. 

After an initial piece laying out the methodology and showing figures for the first week of 2020, we now have enough data through four games to do a deeper dive. 

Let's look at player performance and then, teams.

(Note: The cutoff for qualifying was 147 snaps.)

Player Performance

Attack Ratio - Who's Hot?


  • The above shows the top performers in terms of Attack Ratio with Z scores of 1.00 or better. 
  • Attack Ratio tries to reflect target frequency not just on passes, but on all snaps to account for how the opposing coaching staff might increase or decrease targets based on cornerback personnel. 
  • Marshon Lattimore is a man no one wants to tangle with as he is attacked about 5.3% of his snaps (Z score of 1.72 standard deviations from average).  
  • Every player with a top Attack Z has a Bleed Z above 0.00 meaning their Yards/Snap allowed are better than average except for Ronald Darby and Pierre Desir who have not been thrown on as much as you would think giving they are giving up yards at a worse than average clip.  If offensive coordinators are paying attention, they will likely hit these two up aggressively in Week 5.
Attack Ratio - Who's Not?


  • The above shows the cornerbacks through Week 4 whose Attack Ratio is represented by a Z score of -1.00 or worse.
  •  Not sure what is up with Shaquill Griffin, but he is a marked man as offenses have a target on his back.  Not just is his Attack Z the most brutal (with him being targeted 16.5% of the time he's on the field) but his Bleed Z is horrific as well (I guess that's why his Attack is so high).  He's going to have to shut someone down or the heat will just continue to get worse.
  • Marlon Humphrey is on the list but it's pretty much a function of the opposing QBs have to throw SOMEWHERE vs. a solid Baltimore secondary.  Notice that, despite him getting Attacked so frequently his Bleed Z is positive (meaning his Yards/Snap is better than average) so other teams are not getting their money's worth when they target MH.
Bleed Ratio - Who's Hot?


  •   Jimmy Smith is getting the benefit of the shelling his teammate Humphrey (above) is enduring.  His Bleed Z is the bes through Week 4.
  • Funny thing for Kyle Fuller is, despite his elite Bleed Z, teams are throwing at him more than they would the average corner which, in this case, is far more than they should.  
Bleed Ratio - Who's Not?


  • No surprise here.  Griffin is suffering from no slight case of overbombing. Will have to watch the All-22 to see what is going on here. 
  • Top CB in the last draft class Jeffrey Okudah is certainly getting his on the job training but after looking at him at OSU, I'm not giving up on him.  This will help accelerate his rise in the league.  You have to get the reps in to improve. 
  • The good news is that this list is relatively short and so most corners are in the middle somewhere. 
Burn Ratio - Who's Hot?


  • L'Jarius Sneed  - "We must protect this house!" With no touchdowns allowed and 2 picks over 159 snaps, he's top gun in terms of Burn Z.
  • You love to see the bend but don't break attitude with young players like Okudah and Jimmy Moreland who have had challenges in terms of Attack and Bleed but are keeping the dudes out of the end zone and each collecting a pick over 167 and 170 snaps respectively. 
Burn Ratio - Who's Not?


  • It's called Burn Ratio for a reason and Jason McCourty has been a human torch giving up 3 TDs with 0 picks over 151 snaps.  He has respect because of a near 1.00 Z for Attack and positive Bleed so he might fly under the radar.

Team Performance

Here are charts for each Division comparing the aggregate Cornerback Attack, Bleed and Burn ratios to the QB Rating Z score for each team's Week 5 opponent (in parentheses underneath).


  • NYJ corners have not been too bad per our metrics and they face a ARI passing attack that is below average (in terms of QB Rating).  
  • BUF's corners are talented but not really having a stellar season thus far and they face an above average TEN passing game (if the game gets played, that is). 


  • Although IND's passing game rates about average, they should be able to pepper the CLE CBs who have a pretty rough Attack Z (near 1.00). 


  • TEN CBs have been heavily targeted and will give up yards (far below average Attack and Bleed Z's) and here comes that BUF passing game.  Not lookin good for the Titans.
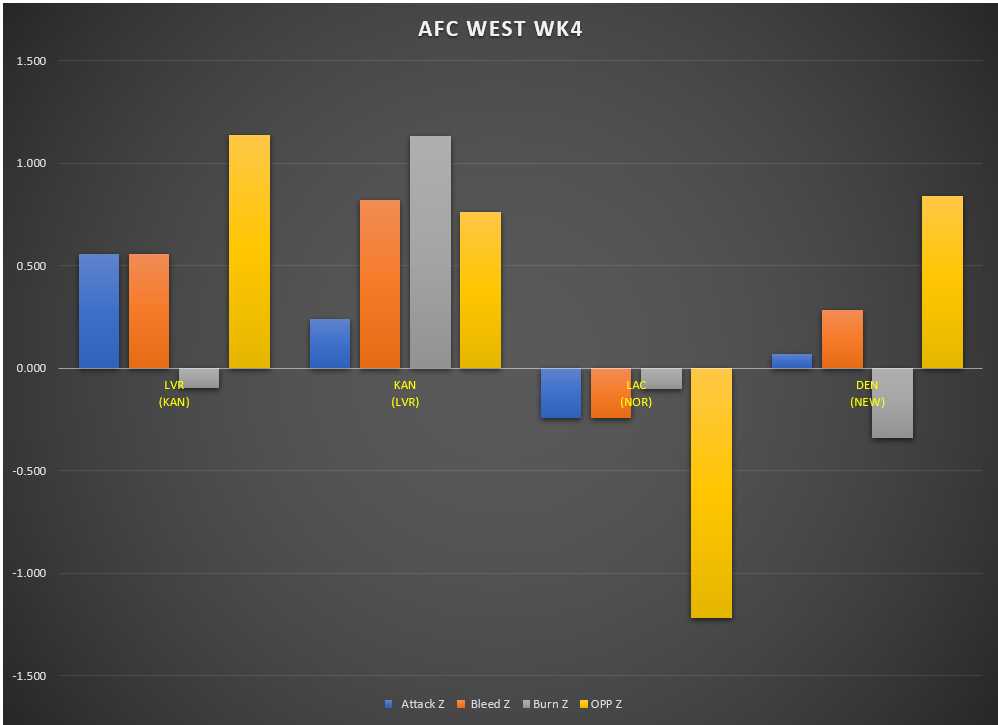

  • DEN has given up its share of TDs so it will be interesting to see how they fare against NWE.
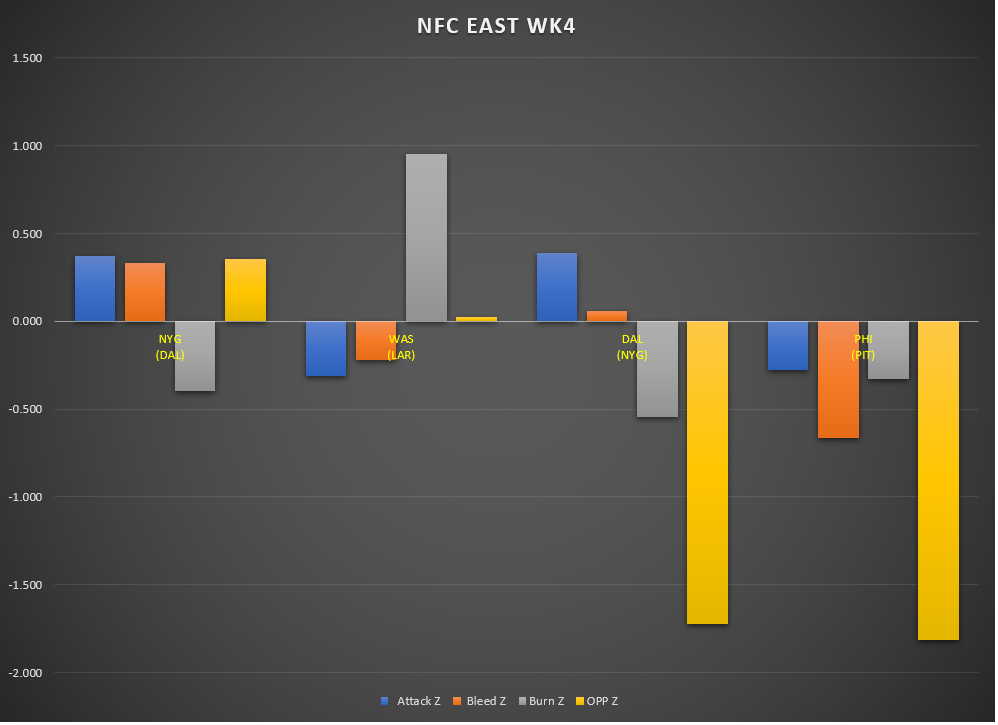


  • DAL and PHI are in luck because their opposition's QB Rating Z is far worse then their respective CB ratios.


  • If you have Russell Wilson in Fantasy, start him this week. CHI and TAM were fairly equally matched up which reflected in their Thursday night game that came down to the wire.
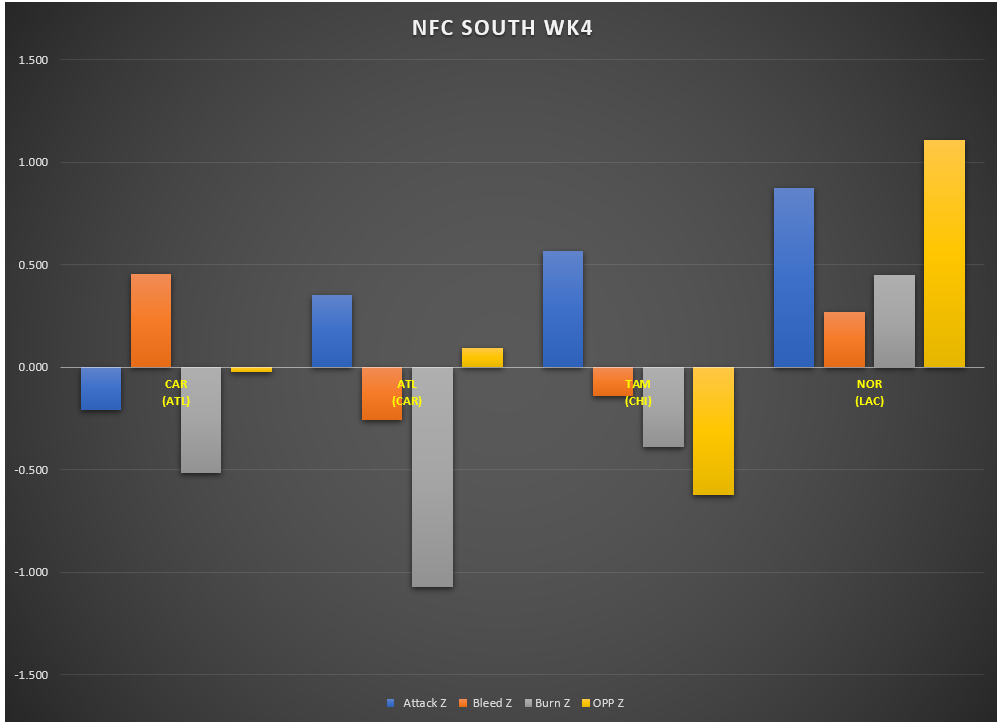


  • Not much here although TAM took on CHI this Thursday so it will be interesting to see how many of CHI's game high 42 pass attempts were targeting TAM CBs.   


  •  ARI has above average ratios (but not stellar) but they fact NYJ which is more than 1.5 standard deviations worse than average.  Perhaps Flacco (subbing for the injured Darnold) can find some of his old magic. 
  • Seems like SEA CB may have a "bend but don't break" CB philosophy - giving up yards between the 20s but stiffening in the red zone.   

Feel free to leave comments about if this seems to have any merit or if you think it totally sucks.  
Thanks and we'll follow up with updates for Week 5.


*************************************************************************************

Looking at NFL QB risk/reward metrics.  Has your team's QB been making the right decisions?  https://boombearfootball.blogspot.com/2020/07/nfl-qb-riskreward-based-on-2019-numbers.html


Check out the full 2020 NFL draft review for value picks and need fulfillment!  https://boombearfootball.blogspot.com/2020/04/nfl-draft-2020-whos-screwed-recap-of.html


The Fourth Annual All-Social Media Top 100 List for NFL Draft prospects is posted...check it out here!  Who did your favorite DraftTwitter football fanatics select?  

Find out here!  https://boombearfootball.blogspot.com/2020/04/boombearjrs-fourth-annual-all-social_22.html


Saturday, September 19, 2020

NFL Cornerback Comparison 2019-2020

 Cover Men

Cornerback is one of the most impactful positions on a football field.  A great one can eliminate the opponent's best receiving weapon and a bad one is a liability that can throw the entire defense into chaos.  For the 2020 NFL season, I will update three metrics I find interesting in looking at CB play:
  1. Total Targets/Total Snaps ("Attack Ratio") - The lower the better.
  2. Total Yards Against/Total Snaps ("Bleed Ratio") - The lower the better.
  3. Total Interceptions/Total Touchdowns ("Burn Ratio") - The higher the better.
Each metric is stated as a Z-score (# of standard deviations from the mean) which is then averaged for a final score.  The player data is aggregated on a team basis. 

2019 Cornerback Statistics 


The above reflects the 2019 results for starting CBs.  Their performances were aggregated by team to provide baseline metrics for comparison to 2020.


Notes:
  • There are only 31 CB units in the table above because none of the starting CBs for MIN had material statistics in 2019.
  • The 2019 numbers reflect the individual numbers of CBs on the 2020 squads for each team.
  • It is said the NFL is a parity league and the numbers show that is the case with only one team's CBs showing performance beyond one standard deviation above the mean (PIT).
  • CAR, while establishing the bottom border, still remained within 1 standard deviation of the mean.  
  • Attack Ratio
    • LAC was #1 in terms of ATTACK ratio meaning teams targeted their CBs the fewest times per snap.
    • PHI was dead last and anyone watching knows they had not a lot of household names on the corners.
  • Bleed Ratio
    • PIT was #1 as their CBs allowed the fewest yards per snap in 2019.
    • CAR has a rough time of it giving up the most yards per snap. 
  • Burn Ratio
    • NWE not only topped the list but they had the highest Z-Score in any of the three categories but having the highest TD to INT rate.
    • ATL was pretty deficient in this category with the worst Z-Score of any team in any category.  

2020 Season

I will update the week to week numbers related to the three metrics (Attack, Bleed and Burn ratios) and compare them to each team's 2019 numbers (above).
Since we only have Week 1 data, we will start with the "Bleed Ratio" Total Yards/Total Snaps compared to 2019 and bring in the other metrics in the coming weeks as we get more data.


Blue lines represent 2019 performance and Orange, Week 1 of the 2020 season.
  • Better than Expected  (Positive Orange line higher than Blue line)- BUF, DEN and TEN
  • Clearly Worse than Expected  (Negative Orange line lower then positive Blue line) - JAX, KC, LVR and PIT
  • Everyone else is not far off expectations with the exception of LAC and NWE who are both on the right side of the line but not show a drop off from last season.  But we have only one game under our belts.

Here's the NFC:


  • Better than Expected  (Positive Orange line higher than Blue line)- CAR, CHI, DET and NOR.
  • Clearly Worse than Expected  (Negative Orange line lower then positive Blue line) - LAR and SEA.
  • Everyone else is not far off expectations with the exception of ATL which was expected to struggle based on last year but has fared worse than expected in Week 1 and NYG who, while still below the line, are much improved in terms of their Bleed Ratio.  

Again, with the less than ideal circumstances this offseason, the early numbers are really just for tracking purposes for now.  Once we get past Week 3, it will be interesting to see how the teams perform to 2019.  As the season progresses, we will add data and charts to reflect the Attack and Burn ratios.

*************************************************************************************

Looking at NFL QB risk/reward metrics.  Is your team's QB making the right decisions?  https://boombearfootball.blogspot.com/2020/07/nfl-qb-riskreward-based-on-2019-numbers.html


Check out the full 2020 NFL draft review for value picks and need fulfillment!  https://boombearfootball.blogspot.com/2020/04/nfl-draft-2020-whos-screwed-recap-of.html


The Fourth Annual All-Social Media Top 100 List for NFL Draft prospects is posted...check it out here!  Who did your favorite DraftTwitter football fanatics select?  

Find out here!  https://boombearfootball.blogspot.com/2020/04/boombearjrs-fourth-annual-all-social_22.html


Monday, September 7, 2020

NFL QB Risk/Reward Based on 2019 Numbers

Risky Business

It is said the best attribute a quarterback can have is a short memory.  After a bad play, it's best to look toward the next one instead of carrying a negative mindset around the rest of the drive or even the rest of the game.  And that negative mindset can interrupt the muscle memory built over countless hours of practice when a QB starts second guessing; he will then become more risk averse.  The difference between QB success and failure can come down to just a few throws a game so it's crucial to remain balanced in terms of maintaining the right amount of risk to justify the resultant rewards.

Let's take a look at NFL QBs from 2019 (per www.pro-football-reference.com) to attempt to understand a bit more about how NFL QBs risk habits relate to their overall performance by looking at the following:
  1. Errors - those made by the QB exclusively and errors that should not be attributed to the QB.
  2. Risk/Reward - analyzing Intended Air Yards and Completed Air Yards.
  3. QB Rating
  4. Understanding if the passing game relied more on the QB or Receiver


Errors

Two types of "errors":

  • Own Errors:  Negative errors.  The total of Interceptions (Int), Fumbles (Fmbl), Batted Balls (Bats) and Bad Throws.  
    • The total is compared to the number of Attempts (Att) with each player graded based on their distribution relative to the top score awarded a 100 and an "average" grade of 70.

Observations:

  • Although Drew Brees made the fewest Own Errors, Derek Carr was a fairly close second earning a grade of 95.8.
  • Not surprisingly, Jameis Winston's league leading 30 INTs and 124 "bad throws" put him at the bottom of the list. 
  • Four non-playoff teams had QBs in the top 10:
    • #2 OAK/LV - Carr
    • #4 DAL - Prescott
    • #8 - ATL - Ryan
    • #10- LAC - Rivers
  • The of the 12 QBs with the highest Own Errors grade, there were three playoff teams represented:
    • #30 BUF - Allen
    • #22  PHI - Wentz
    • #21 BAL - Jackson
  • Both the Offensive MVP (Jackson) and Rookie of the Year (Murray) had below average Own Errors grades.

  • Other Errors:  Non-QB driven errors.  The total of Throwaways and Drops divided by Attempts.  (I'm sure some would argue some throwaways are the QBs fault but not for this analysis).


Observations:

  • Although Stafford had a rough year in terms of Own Errors (#28 overall), his receiving corps did a nice job getting open and holding on to the ball.
  • Allen, who was #30 in Own Errors didn't have a whole lot of help from his guys.
  • Looking at Rodgers at #24 with a failing GB grade in Other Errors makes their draft even more painful with a 6'2" TE as their only receiver selected.
  • Brady being near the bottom of the list at #31 and TB being at #14 despite Winston under center makes me very, very scared of the Bucs this year. 

Risk/Reward

Now that we can see how each QB and his team stand in terms of errors, let's try to see what we can surmise once we look at the degree of risk a QB is willing to take to gain a yard. 

Intended Air Yards:  Air yards on all pass attempts, whether complete or incomplete.
Completed Air Yards:  Yards that a pass traveled beyond the line of scrimmage before being caught.

Comparing the average intended air yards to the average completed air yards and we see how much risk a QB is willing to take to get one yard, represented by "Risk Reward (IAY/CAY)".

The average CAY is 4.0 yards and so not to reward QBs who do not make this threshold, the rankings were ordered based on CAY > 4.0 then Risk Reward


Observations:

  • Drew Brees has by far the lowest Risk Reward ratio where he risked only 1.21 yards for each passing yard gained.
  • Interestingly, the top 10 was split 50/50 between playoff and non-playoff teams with Matty Ice holding the #2 spot. 
  • Rudolph had a pretty rough year all around but his highest Risk/Reward rating shows the ball well over twice as far as the overall #1 Brees to get the same yard.
  • Rodgers is second to last, not far from Rudolph.  So is the conclusion these two are similar?  Let's try to rap this up to see what we can determine.

Who's Responsible?

Now that we understand QB errors, Other errors and Risk Reward, let's see if we can draw any conclusions:

Key to Colors


Looking at the Ratings from Left to Right we assign responsibility for each teams' success in the passing game.

Observations:

  • Brees takes minimal risks (Highest Risk/Reward grade) has a high QB rating (converted to our base 100 system), his Receivers Own Errors are > 1 Standard Deviation from the mean but his Own Errors are greater than 2 Standard Deviations from the mean.  
    • As much support as he gets from this players, Brees is clearly driving the results.
  • Looking at Matt Stafford, he had an above average Risk Reward Grade so he's not afraid to air it out to get his yards and while he had a strong QB rating, his Own Errors were below average.  Conversely, his Receivers Own Errors were top of the league, performing two levels above their QB.  
    • Based on this, their success was driven by the Team more than Stafford. He was dinged up a lot last year so if he's 100%,  we would expect him to be more of a contributor to the Lions' success. 
  • Poor Derek Carr took a lot of heat last year but when you take a look at his numbers, he has an above average QB rating, he is near the tops in assessing Risk/Reward and he is disciplined in terms of Own Errors.  
    • The Team was near the bottom of the heap in terms of Errors performing a whole 3 levels below Carr.  Maybe the critics are too harsh on him?
  • QBs with above average metrics and below average Team metrics:
    • Cousins
    • Prescott 
    • Mahomes
    • Carr
    • Brady
    • Rodgers 
  • QBs and Team both have above average error metrics:
    • Ryan
    • Tannehill
    • Wilson
    • Watson
    • Rivers
    • Garappolo
    • Trubisky
  • QBs with below average metrics with above average Team metrics:
    • Stafford 
    • Fitzpatrick 
    • Winston 
    • Jackson
    • Keenum
    • Goff
    • Murray
    • Wentz
    • Jones
  • QBs and Team both have below average Error Metrics
    • Minshew
    • Dalton
    • Mayfield
    • Darnold
    • Josh Allen
    • Kyle Allen
    • Brissett

What's the Bottom Line?

  • Risk Reward has a fairly solid correlation with QB's Own Errors (Better performing Risk Reward/Better performing QB's Own Errors).  
  • QB Rating has a meaningful correlation with QB Own Errors and Risk Reward.
  • Others Errors have no meaningful correlation to the other metrics.  


Error Efficiency
The above gives context to the rate at which QB accumulate Owned and Unowned Errors on pass plays.  Does this mean Derek Carr was the best quarterback last year?  Of course not.  He was just the most conservative.  In fact, he was so conservative, he pretty much blew the curve. 
But what was the price for being so conservative?  Let's take a look at other QB metrics to try to make sense of this all.


IAY and CAY


Intended Air Yard and Completed Air Yards are two measures to help us look at how far the average passing attempt is compared to the average distance for completed passes. 


For context the top five in terms of IAY were:

  1. Matt Stafford: 10.6 IAY (29.4% farther than the 8.2 IAY peer group average [PGA])
  2. Jameis Winston: 10.4 IAY (26.9%)
  3. Ryan Tannehill: 9.5 IAY (15.9%)
  4. Russell Wilson: 9.4 IAY (14.7%)
  5. Dak Prescott/Josh Allen: 9.3 IAY (13.5%)
The above represents an aggregate record of 46-35-1 and 3 2019 playoff teams (one making it to conference championship game).


The bottom 5 in terms of IAY were:
  1. Drew Brees: 6.4 IAY (-21.9% shorter than the PGA)
  2. Jimmy Garoppolo: 6.5 IAY (-20.7%)
  3. Derek Carr: 6.6 IAY (-19.5%)
  4. Joe Flacco: 6.7 IAY (-18.2%)
  5. Case Keenum: 6.9 IAY (-15.8%)
The players above represent an aggregate 43-37 record and two playoff teams (one making it to the Super Bowl).


For Completed Air Yards:
For context the top five in terms of CAY were:

Thursday, July 16, 2020

Safety Dance - Is Jamal Adams Really Not a Good Safety?

Michael Lombardi of The Athletic had some strong words for Jamal Adams.  After equating his current contract extension request with the legendary Seinfeld episode where George Costanza attempts to get fired by the Yankees, he ups the ante by detailing numerous shortfalls he claims riddle Adams' game.

While I will not examine Lombardi's claims about Adams' alleged sabotage of his Jets career by asking for fair market compensation compared to his rookie contract, this piece will look at his claim as to why, based on performance alone, Jets GM Joe Douglas would be better off moving on from the All-Pro safety.

I took a look at the safeties listed in the Pro Football Focus article on the top 10 NFL tandems (https://www.pff.com/news/nfl-best-safety-2020-nfl-season-minnesota-vikings-new-england-patriots) and compared the numbers (thanks to www.pro-football-reference.com). Here's what I found out.

Penalties

Lombardi said Adams' game is predicated on the big hit and the intimidation factor it has on receivers. This leads to roughing penalties that will be a huge liability for the team as the league has increased attention to such penalties.


  • Over his career Adams has had 4 Unnecessary Roughness/Roughing the Passer penalties.  Compared to the players in the PFF piece, for context, when considering the number of defensive snaps he took, he is about in the middle of some notable names.  
  • It must be considered his 3rd and 4th penalties took place on consecutive plays vs. JAX in 2019.  His play is based on reading and reacting, not blowing guys up.  Gase properly saw that Adams was too keyed up in the JAX game and sat him down.  If Coach had done that a play earlier and Adams had only the one penalty, his rate would have been 1 Roughing Penalty for every 1,035 snaps.
While the raw numbers put Adams near the "questionable" end of the spectrum, considering half of his Roughing penalties occurred on consecutive plays, I would be hesitant to say he's in the Burfict punishment realm.  And simply watching his play style is enough to debunk the claim of him being a goon.


Scheme Liability

"Gregg Williams knows Adams... struggles to cover the top receiving tight ends or backs as well as defending the middle of the field when Williams wants to play Cover 2."  Lombardi goes on to say, "...but with both Adams and Marcus Maye at Safety, the Jets lack range and playmaking skills when both on the third level. Both safeties have just seven passes defended and one interception apiece last year."


The most remarkable part of the commentary above is the clear miss that, of the key personnel for a Cover 2, Adams and Maye were the two you would most trust in 2019. The necessary physical corners who can jam receivers off the line (squat corners as we called them on my high school team) were not in large supply on the Jets last year.  But even more glaringly absent was a top flight MLB who could call out adjustments AND still hustle down field to cover the middle.  You think of Derrick Brooks or Brian Urlacher when you think Cover 2 linebackers and no such name was available to NYJ for most of the season.  Mosley was solid when healthy but once he got hurt they had no dependable LB.  Adams was moved around so much primarily because there was no one of Mosley's ability the team could trust at all three levels of the defense except Jamal.

Inability to Cover/Lack of Playmaking


Regarding the article's claims against Adams' ability to cover receivers, the good news is the data for opponent completion percentage is readily available.  How did Adams do relative to his peer group?


  • Of the 20 safeties mentioned in the PFF "Top Safety Duos" piece, Adams was #7 in terms of lowest receiver completion rate (his partner, Maye, ended up third).  Each would be one notch higher if we exclude Diggs who's targets were more than one standard deviation beyond the mean.
  • Based on the peer group, Adams' completion percentage was within 1 standard deviation above the mean.
Of course, it could be that perhaps even though he is in the top 10 of opponents completion percentage, maybe he gets beat deep and gives up the long ball.  Could that be what Lombardi is referring to?


Average Yards per Target


  • Looks like Adams is in the top 3 of the data group in terms of Yards per Target mapping to a grade of 93.1.
  • His Partner in Crime Maye, however, does seem to struggle giving up 10 yards per target.
  • It is amazing to see teams kept challenging Mathieu (who was targeted 80 times!) although he is clearly effective with 5.1 Y/T, far better than average.
Let's take a look at this again, this time broken out by comparing Air Yards and Yards After Catch each per Completion.


Air Yards


Adams seems to keep everything in front of him (6.1 air yards) so the numbers don't support him getting beat deep often.  He comes in at an above average grade of 81.0 in terms of Air Yards per Completion. 


Yards After Catch


Here is where Adams excels giving up only 2.8 yards after the catch which grades out to a 96.9 in the peer group.
Not sure if Marcus Williams had some kind of soft tissue injury last year but his rate was absolutely frightening!


Missed Tackles


Again, Adams is near the top of the pack grading out to a 98.5.  Maye also ranks above average.  Now, the 80 targets on Mathieu makes a bit more sense with his high missed tackle percentage.


Wrap up


So, when you take all categories and compare Adams to the peer group composed of the top 10 safety duos according to PFF, he ends up as the statistical top safety.  Wow...who would have thunk it?

At the end of the day, I could forgive fans once again aligning with the owners in a contract dispute but to somehow say the man is not talented and held back the team?  That's just bitter. 

**************************************************************
The Fourth Annual All-Social Media Top 100 List for NFL Draft prospects is posted...check it out here!  https://boombearfootball.blogspot.com/2020/04/boombearjrs-fourth-annual-all-social_22.html

Saturday, May 23, 2020

2017 NFL Draft In Review - Who Were the Top Twitter Scouts?

Representing DraftTwitter

For those of you who didn't check out my 3rd anniversary review of the very first All Twitter Top 100 Players selected in the NFL 2017 Draft, get up to speed here.

The football gurus, in aggregate, ended up only 1.5% behind the actual NFL draft in terms of how closely they ranked players to their actual value to their teams since their draft date.   But which of our DraftTwitter all-stars showed out the best?   Glad you asked!  

The Dirty Dozen

Below are the top 12 DraftTwitter scouts from 2017 - The Dirty Dozen. On average, their drafts were 8% better than the actual NFL draft (which graded out to 66.1%) in terms of ordering the top 100 prospects in the 2017 NFL draft based on utilization and performance metrics (I'm telling you, go back and read the recap post via the link above).

 
  • These twelve scouts posted above average grades compared to the other scouts in our 2017 NFL Draft All Twitter Top 100. 
  • They all had better drafts than the aggregate for the 32 NFL teams based on our metrics.
  • Yellow represents finishing within 1 standard deviation of the mean of the scouts surveyed. 
  • Green represents finishing above 1 standard deviation of the mean.
  • Greatest Hits represents the picks these guys nailed (not counting Myles Garrett).  For example, Bill Carroll had Adoree Jackson at #37 and that is how he has graded out in the analysis.  
  • Greatest Misses is just the opposite and can be guys we slept on or those who were totally overvalued.
    • Clearly, Forrest Lamp was a guy who was expected to have a bigger impact than he has been able to provide the last three years. 

Back into the Vault

Putting 2017 to bed for another 2 years so we see how the players and how our scouts' picks hold up at the 5 year mark.   Up next year - review of the 2018 DraftTwitter Top 100.  See you there!


*********************************************************************************

Which teams had the best NFL drafts based on Needs?  How about based on Value?  Have that right here for you!    

Thursday, May 14, 2020

First EVER 3 Year Recap of DraftTwitter Top 100 from 2017

Three Years in the Making!

How would the average Twitter football know-it-all do against NFL General Managers in terms of picking draft prospects?  

In 2017, this crazy idea kicked off an odyssey that has brought hundreds of football fans together to debate, share scouting methods and have fun while voting to help compile what has become an annual tradition, the DraftTwitter Top 100.  Here are the results of the very first survey.

The idea is simple: take super-enthusiastic NFL draft fans, give them a chance to rank their top 100 prospects for the upcoming draft and crunch the numbers to get an aggregate list that should smooth out the bumps to reflect the draft sentiment of the Twitterverse. 

I promised to review the performance of the Aggregate Top 100 list to the results of the actual NFL GMs to see who did a better job.  So here it is, the very first 3 year review for the 2017 NFL Player Draft!

Step 1.  Determine the true Top 100 players in the 2017 NFL Draft

Sure, we ranked players we thought were the best and the pros spent millions in scouting resources to actually drafted them.  But 3 years later, neither group's ranking of the plays (through the DraftTwitter Top 100 and through the first 100 players picked in the 2017 NFL Draft) reflects the true ranking of the best players in that draft from 1 to 100.  So, we will create that list right now.

The process of stack ranking players uses three measures to determine an overall score based on (1) importance of that player to his team and (2) player production compared to his peer group.
  • Importance to Team- For all players except quarterbacks, Games Started and Positional Snaps (Special Teams play is not included) are the first two measures in the calculation used to determine the rankings.  The assumption being coaches put their most capable players on the field and, if a player can maintain his starting spot or generate a high number of snaps compared to his peer group, he has high importance.  
  • Production - Each position has a production metric calculated over the first 3 years of his career:
    • RB:  Yards from Scrimmage/Snaps
    • WR and  TE: Receiving Yards/Snaps
    • Offensive Line: Snaps/Penalties
    • DL: Snaps/(Tackles for Loss plus Sacks)
    • LB:Snaps/(Solo Tackles plus Tackles for Loss plus Sacks)
    • S: Snaps/Total Tackles
    • CB: Target Ratio (Catches Allowed/Times Targeted)
  • Quarterback Stat Ranking: Top 100 QBs are given far more opportunity to fail as opposed to other players and so the Importance to Team metrics above are not as helpful.  Instead we look at:
    • Passing Yards/Attempt = 50%
    • Touchdowns/Interceptions=50%
Players are graded in their respective position groups with the top player awarded 100 points and each subsequent player graded based on their relationship to the top position and the mean.  The differential between the top player and the next is recorded, and so on.  This differential is used to gauge how much better a player is compared to the next in his position group, which is key in breaking ties.  

The three metrics are averaged and all players are ranked regardless of position with ties broken by the position differential.  

The Actual 2017 NFL Draft Top 100


  • Actual Score:  Score generated from the stack ranking exercise above. 
  • Expected Score:  Expected Score if player performed exactly to the level he was drafted, based on the actual top 100 scores.  
  • Value +/- : The Value gained or lost based on Expected Score compared to Actual Score.
  • No Expected Score or Value +/- means player was drafted outside the Top 100.
For example, Patrick Mahomes (shocker) was the #1 player in the 2017 so his Actual Score is 100.  He was the the 9th pick overall and so, based on the actual scores, the 9th player's score is 96.2.  The Actual Score minus the Expected Score divided by the Expected Score shows he provided 3.9% value based on the analysis.  

Sleepers and Underperformers

Here are the Sleepers, guys who way outperformed their draft positions. 


And the Underperformers:


Step 2: Assess Scores of NFL and DraftTwitter Based on Actual Scores


Lining up the results, we score each draft pick based on how much off the NFL and Draft Twitter Pos(ition) it is compared to the 2020 Value (as we figured out above). 

Going back to the Pat Mahomes example, he was drafted 10th overall but is the #1 player in his draft.  Because the NFL Draft had him 9 slots lower than he earned out, we deduct those 9 points from the possible 100 points for each player.  So, he was worth 91 points to the NFL and only 67 points to DraftTwitter who were much lower on him (although, in line with many sources that also overlooked Mahomes).

Any player with a position > 100 was not in the NFL's or DraftTwitter's Top 100 and so the score is a zero. 

All the scores are averaged and, if you scroll down, you will see if the NFL GMs or the DraftTwitter guys had better results...


And the Winner is...

OK, so the GMs reign supreme like they should (they get paid enough) BUT the margin of victory is just 1.5 points.  I know the term "moral victory" does not belong in football but I think we will take it here...

Shout out to the Contributors 

These guys came through by providing the first survey results.  Many have gone on to bigger and better things but they all stay connected to the DraftTwitter community.  Looking forward to breaking down their individual draft performances in the next article. 


**************************************************************************************

Check out the full 2020 NFL draft review for value picks and need fulfillment!  https://boombearfootball.blogspot.com/2020/04/nfl-draft-2020-whos-screwed-recap-of.html


The Fourth Annual All-Social Media Top 100 List for NFL Draft prospects is posted...check it out here!  Who did your favorite DraftTwitter football fanatics select?  

Find out here!  https://boombearfootball.blogspot.com/2020/04/boombearjrs-fourth-annual-all-social_22.html